Methodology · actual weather · DE-LU
Ten months of German weather in one circle
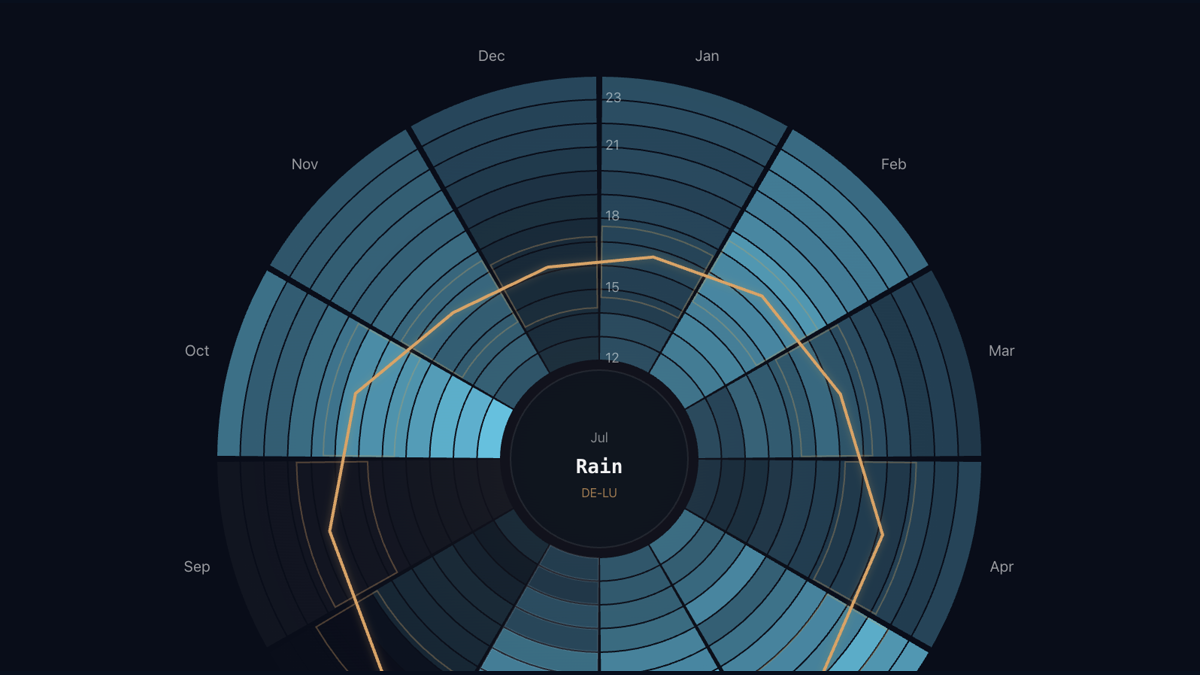
Month runs around the edge. Delivery hour runs from the centre outward. Sunset stays fixed in amber. Change one layer at a time to see measured rain, cloud, wind, temperature or solar radiation—without mixing weather with a trading score.
Published 2026-08-08 · frozen weather window 1 October 2025–2 August 2026 · DE-LU only
Actual-weather year wheel
Loading frozen DE-LU weather…
Choose one weather variable. Hover a cell for its exact month, hour, value and source. Use left/right arrow keys on the wheel to move by month. The amber curve is calendar sunset; its outlined band spans two hours before to one hour after sunset.
Text equivalent and layer definitions
- Rain: mm/hour; DWD gauge measurement.
- Cloud, wind, temperature and radiation: ERA5 reanalysis.
The downloadable JSON contains every displayed month-hour value: public weather-wheel dataset.
What you are looking at
A calendar is linear because it is built to count days. Energy systems are cyclic. Daylight leaves and returns; heating demand rises and falls; weather regimes occupy seasons; the evening ramp follows sunset around the year. A circular layout places January beside December and gives every month the same angular width. That makes continuity visible without asking the reader to mentally join the ends of a chart.
Each wedge is a calendar month. The innermost coloured ring is 12:00 local time in Europe/Berlin; each ring outward advances one hour until 23:00. A cell therefore means one precise thing: the average value of the selected realized-weather variable for one month and one local delivery hour in the frozen observation window. Hovering October at 18:00 is not a forecast for a future October. It is a summary of observations assigned to that month-hour cell.
The amber curve is sunset at Germany’s geographic centre, calculated for the middle of each month. The thin outlined band begins two hours before sunset and ends one hour after. Sunset is not data-mined against any outcome. It stays fixed when the weather layer changes, providing a physical clock against which cloud, radiation, temperature and wind can be read.
Five layers, and only five
This public wheel exposes measured rain, cloud cover, wind speed at 100 metres, temperature and solar radiation. It does not expose hit rate, fills, net per day, profit and loss, residual load, residual-load ramp, model decisions or challenger performance. Those are not merely hidden controls. They are absent from the public JSON contract.
The distinction is architectural. The internal research surface uses a larger artifact to inspect
weather beside a paper intraday classifier. Publishing that artifact and hiding some options with CSS
would still send private strategy fields to every reader. Instead, a separate exporter creates
voltcast.actual-weather-year-wheel.v1 from an explicit field allow-list. A contract test
rejects forbidden keys. The public visualization cannot reveal a metric it never receives.
This is also why the paper does not claim a weather-only trading edge. The wheel describes realized physical conditions. It does not establish causality, and realized observations are not necessarily available at a decision clock. Voltcast’s weather trader remains the only live trader. The intraday classifier that motivated the internal mechanism explorer remains paper-only.
Rain is measured; cloud is not used as a proxy
Historical rain comes from 40 direct hourly precipitation gauges in the Deutscher Wetterdienst Climate Data Center’s rolling recent product. Each gauge is matched to one point in the 40-point German weather field. The frozen extraction contains 7,296 matched hours. Median nearest-gauge distance is 8.9 km; the maximum is 86.6 km. Those distances are part of the uncertainty, especially for convective rain.
The primary rain layer is the arithmetic mean of the matched gauge measurements, expressed in millimetres per hour. It is not inferred from cloud cover. Rain and cloud are physically related but not interchangeable: a thick cloud deck may produce no gauge precipitation, while a localized shower may affect a small share of the field. Keeping separate measurements prevents a visually plausible proxy from masquerading as observation.
ERA5 rain remains in the frozen research artifact as a quality cross-check but is not present in the public wheel. Gauge and ERA5 hourly rain correlate at 0.830 in the extraction, with means of 0.06751 and 0.06701 mm/hour. That agreement makes a gross time-zone or unit error unlikely. It does not make the sources identical, and it does not turn reanalysis precipitation into a gauge.
DWD’s rolling recent files are quality controlled operationally but are not the final annual archive.
The exact extracted source is hash-frozen as
b2ff40de2e41ca3c6c5e6b7f1c59daccca2ccc18fbf1cc2f79e92fdbb5782aea.
A future annual revision may improve individual values; it must not silently rewrite this publication.
The other four layers are ERA5 reanalysis
Cloud cover, temperature, 100 m wind and shortwave radiation come from ERA5 through Open-Meteo’s historical weather interface. Reanalysis combines a numerical weather model with assimilated observations to reconstruct a spatially complete history. It is not a station instrument and it is not a forecast that was available in real time. “Actual weather” in this paper means realized historical conditions, with the source type stated for each variable.
Cloud cover and radiation are weighted toward the German solar fleet. Wind at 100 metres is weighted toward installed wind capacity. Temperature is averaged over the field rather than forced through a wind or solar weighting. Rain uses the direct gauge matches. These quantities should not be collapsed into one weather index because their physically relevant spatial weights differ.
The 100 m wind layer approximates conditions near modern hub height. It is not turbine output. No power curve is applied in this paper, and no wake, cut-out, icing or availability model is implied. Solar radiation is incoming shortwave energy in W/m². It is not photovoltaic generation and does not include panel orientation, module temperature, inverter limits or curtailment.
The 40-point field
A country centroid is attractive because it is easy. It is also a poor description of German weather.
North Sea wind, Baltic wind, the northern plain, western load centres and southern solar regions can
occupy different regimes at the same hour. The field therefore uses 40 capacity-weighted centres,
identified by the frozen scheme de-fleet-k40-20260805.
The centres span 48.24–54.84° N and 6.15–14.38° E. The largest wind clusters fall in Schleswig-Holstein, the German North Sea, Brandenburg and eastern North Rhine-Westphalia. Their purpose is not to divide Germany into 40 equal areas. Their purpose is to sample where renewable capacity makes weather economically and physically consequential.
Capacity weighting creates a trade-off. It is appropriate for wind and radiation when the question is fleet exposure, but less natural for temperature-driven load and direct rain measurement. The dataset therefore retains variable-specific aggregations rather than pretending one set of weights answers every weather question.
Why the wheel starts at noon
The radial axis covers local delivery hours 12 through 23. That range came from the internal DE-LU afternoon and evening mechanism audit, where sunset and the solar ramp are central physical references. It is not a claim that morning weather is unimportant. A 24-hour wheel would need either twice as many rings or half the radial precision; both make exact cell inspection harder on an article-width canvas.
Local time is Europe/Berlin. The aggregation respects the delivery-hour label used by the underlying research pipeline. Daylight-saving transitions therefore need explicit handling upstream: a local hour may occur twice in autumn or be absent in spring. Month-hour means summarize the available observations; the displayed observation count determines coverage rather than an assumed number of days.
Coverage and the danger of a complete-looking circle
The frozen weather window runs from 1 October 2025 through 2 August 2026. It contains October, November and December from 2025 and January through early August from 2026. The wheel places those month numbers around one annual circle. It is a seasonal view of one continuous ten-month window, not a climatological normal and not twelve full independent months.
A cell reaches full opacity at 20 hourly observations. Cells with fewer observations fade. August is visibly partial because the source ends on the second day of the month. September has no observations in the frozen window and stays neutral. The visual absence is the result. We do not interpolate missing September values merely to complete the ring.
Month cards show the number of days behind each monthly average. The source line gives the field size, date range and first 16 characters of the frozen hash. Exact values remain downloadable as JSON so a reader does not need to reverse-engineer a colour.
How to read each layer
Rain
The rain palette is deliberately nonlinear: colour intensity uses the square root of the normalized value. Rain distributions are zero-heavy with occasional larger values; a linear scale would compress most ordinary wet hours into nearly the same dark tone. Hover values remain linear millimetres per hour. Colour transformation changes legibility, not the number.
Cloud cover
Cloud is shown as percent cover from dark slate to pale grey. It is solar-weighted across the field. Cloud percentage does not encode cloud optical depth or height, and the same total cover can produce different radiation depending on cloud type and sun angle. Read it beside radiation, never as a replacement for radiation.
Wind at 100 metres
Wind uses a teal-to-green scale in metres per second and is weighted by installed wind capacity. A high value means the registered fleet’s sampled points were windy on average. It does not mean every turbine was generating at that capacity factor, nor does it include outages or local wakes.
Temperature
Temperature uses a blue-to-orange sequential scale across the values present in the frozen dataset. The colours are relative to this wheel, not universal warning thresholds. The exact °C value in the centre and hover text is the authoritative reading.
Solar radiation
Radiation runs from brown to gold in W/m². Its strongest geometry follows daylight: zero or near-zero values sit outside the sunlit interval while the daytime arc broadens toward summer. The fixed sunset curve makes that relationship readable without assigning sunset a fitted coefficient.
Animation is navigation, not evidence
“Play year” advances the highlighted month. It does not interpolate weather between months, generate a forecast or alter the values. Changing a layer fades the same 132 month-hour cells into a new palette over 360 milliseconds. Reduced-motion users receive the same state change without the transition.
The downloadable loop records the actual canvas while stepping through twelve months at a fixed cadence. The poster button exports the current layer as a PNG. Both include the same geometry and values as the interactive wheel. They are distribution formats, not separate analyses.
What this wheel can establish
It can establish the values in the frozen aggregate, their sources, their calendar-hour arrangement and their broad seasonal co-movement. It can show, for example, that radiation follows daylight geometry, that winter afternoon temperatures differ from summer, or that a wet hour is not synonymous with a cloudiest hour. It can help a domain expert select more precise follow-up questions.
It cannot establish that a weather variable caused a market outcome. There is no outcome on this public wheel. It cannot establish a trade that was available at a historical decision time because ERA5 is realized reanalysis and DWD recent observations arrive after the fact. It cannot establish German climatology because the window is shorter than one year. It cannot establish Luxembourg-local weather because the field is German while the market label is the coupled DE-LU bidding zone.
Realized weather versus decision-time weather
A mechanism audit asks what physical conditions actually occurred. A prospective trading feature asks what a system knew before an order deadline. Those are different datasets even when they share variable names. Realized rain can validate a forecast; it cannot be substituted for that forecast in a backtest.
Voltcast’s append-only weather recorder therefore stores forecast vintages with model identity, issuance time, first receipt time, valid time, completeness and a content hash. A weather-conditioned decision must reference a receipt that existed before its declared clock. Nothing in this article promotes the realized wheel into that decision plane.
Known limitations
- The window is 1 October 2025–2 August 2026, not a complete year and not a climate normal.
- DE-LU is represented by a 40-point German field; Luxembourg is not separately sampled.
- DWD rain gauges are point measurements with uneven nearest-field distances.
- DWD’s rolling recent product can later be revised in the final annual archive.
- ERA5 values are reanalysis and provider-interpolated to field points, not direct station readings.
- Wind, cloud/radiation and temperature use different physically motivated weighting choices.
- Only local hours 12–23 are shown; morning and overnight weather are outside this visualization.
- Relative colour scales aid pattern reading but should not be compared as equal physical magnitudes across layers.
- No weather pattern shown here is a live trade, forecast skill score or causal market result.
Data contract and reproducibility
The public file is
/research-data/de-lu-actual-weather-year-wheel-v1.json
. Its schema is voltcast.actual-weather-year-wheel.v1. It contains the zone, timezone,
hour bounds, source metadata, five layer definitions, allow-listed month-hour rows, allow-listed monthly
rows, sunset geometry and attribution. It contains no generic “extra” object into which private fields
can drift.
- Extract actual zone weather on the frozen 40-point scheme.
- Match DWD hourly precipitation gauges and retain the source hash.
- Aggregate each permitted variable by calendar month and local hour 12–23.
- Aggregate weather-only monthly cards and compute calendar sunset independently.
- Run the public allow-list exporter; compare the committed JSON byte-for-value with the contract output.
- Fail the test if any strategy, PnL, fill, hit-rate, residual-load, decision or challenger key appears.
Sources and attribution
Rain source: Deutscher Wetterdienst (DWD), Climate Data Center, hourly precipitation observations, CC BY 4.0. DWD requires appropriate source acknowledgement. The extraction uses the rolling “recent” product and states that it is not final annual quality-controlled history.
Cloud, wind, temperature and radiation: ERA5 obtained through Open-Meteo. Weather data by Open-Meteo.com, CC BY 4.0. Contains modified Copernicus Climate Change Service information 2026. Neither the European Commission nor ECMWF is responsible for any use that may be made of the Copernicus information or data it contains.
ERA5 reference: Copernicus Climate Change Service, ERA5 hourly data on single levels from 1940 to present, Climate Data Store, DOI 10.24381/cds.adbb2d47.
Citation
Voltcast Research (2026), “Ten months of German weather in one circle,” published 8 August 2026.
Dataset: DE-LU actual-weather year wheel v1, weather window 2025-10-01 through 2026-08-02,
source hash b2ff40de2e41ca3….
Why publish the mechanism without the strategy
Weather is public evidence. A private model’s score is a different object. Combining them in one screenshot can make association look like explanation and can make hindsight look tradable. The public wheel is deliberately narrower: it gives researchers, grid analysts and journalists a precise way to inspect the physical calendar while refusing to smuggle an outcome into the colour scale.
Competence is not demonstrated by putting every available metric on one screen. It is demonstrated by maintaining source identity, decision-time semantics, units, missingness, licences and negative results when the visual would be more dramatic without them. This wheel is one layer at a time because the underlying facts deserve that discipline.
The monthly European power roundup
Negative-price records, the biggest spreads, which zones were hardest to forecast — every number computed from our production data, on the 2nd of each month. No filler, unsubscribe anytime.