Can smart EV charging absorb solar’s low-capture-price hours?
Can smart EV charging absorb solar’s low-capture-price hours. A lower capture rate identifies solar-heavy low-price periods that flexible EV load could absorb.
Abstract
Solar capture rate compares the market value received by solar-shaped production with a broader market price reference. A low rate can identify periods in which solar output is concentrated in relatively low-price hours, suggesting a possible role for flexible demand. In the frozen evidence for this paper, the median capture rate among 224 frozen solar observations is 0.632. This is a market-value diagnostic, not a simulation of electric-vehicle charging.
The evidence explicitly assumes that charging capacity is not modeled. It contains no fleet size, plug-in availability, energy requirement, charger power, network constraint, or interval-level counterfactual demand. The result therefore cannot answer whether real EVs can absorb the identified output, how much they could absorb, or what effect they would have on prices. It also does not estimate emissions. Low-carbon generation share elsewhere in the family remains an operational proxy, not lifecycle marginal emissions. This paper frames the capture-rate result as an opportunity signal while rejecting stronger claims about physical absorption, causality, household bills, or measured household emissions.
Plain-language answer
The data show a solar market-value pattern that flexible EV charging might be able to use, but they do not show actual absorption. The median frozen solar capture rate is 0.632 across 224 observations. A rate below the broader price reference is consistent with solar output being concentrated in lower-priced periods.
That pattern creates a scheduling question: if cars are connected and need energy during those periods, moving charging there could align load with relatively low-price solar-heavy hours. The word “could” is essential. The evidence does not model charging capacity or compare EV demand with available solar output. It does not show how much load would move or whether grid constraints would permit it.
The result is not an emissions claim. Solar capture value and low price do not identify lifecycle marginal emissions or the generator responding to new load. No measured household bill or household emissions are reported.
Research question
The registered question asks whether smart EV charging can absorb solar’s low-capture-price hours. The measured question is narrower: what is the median capture rate among solar capture-stat records whose status is frozen? That statistic indicates the relative market-value environment in which a flexibility hypothesis might be tested.
Physical absorption would require matching an incremental charging profile to solar output by interval and location. It would also require vehicle availability, energy needs, charger limits, and network conditions. None of these is represented in the primary outcome. The paper therefore distinguishes an economic timing signal from an implemented flexibility response.
The research contribution is to document the first side of the matching problem: the frozen solar capture-rate distribution has a median of 0.632. It does not complete the demand side and makes no causal claim that smart charging raises capture rates.
Data and provenance
The public evidence JSON named in frontmatter is canonical for this paper. The registered family contracts are generation_mix, day_ahead_prices, capture_stats, res_accuracy, and zone_temp_weighted. The primary result filters capture_stats to solar rows with frozen status and non-null capture rates.
The evidence lists daily-price metadata from 2021-01-01 through 2026-08-29, detailed intervals from 2025-10-01 through 2026-08-29, and long history from 2015-01-01 through 2026-08-29. The publication cutoff is 2026-08-30T00:00:00Z. Extraction was read-only and used a 180-second statement timeout.
The provenance hashes are snapshot 7e97489fc8528c8cc8c38830e05b48d949ce1f67b98575dff26f5d7c321e4c67, analysis code 57c57de79cdab2b5b6d6c54c485cb5162598c5ba0b0bfe995da40d75e6c52ba9, protocol adb36bf6b447af9f96339249b8becaefc20422499cca1977242866347a97bd4b, paper registry 7bcb91d7476d0a69fe9fa75a5c7782f8117e0153f82f9112b7e1d307d3943717, and source registry 07949550ac443ff673fda5c0209b99f137544f3ffecf6775f109bb9d09663bd6.
No EV telemetry, household charging sessions, customer bills, or household emissions appear in the source contract. The evidence records one explicit assumption: charging capacity is not modeled in this market-value diagnostic.
Method
The calculation selects capture-stat records for which the technology is solar, the status is frozen, and capture rate is available. It extracts those ratios and reports their median. The figure presents the registered P10, median, and P90 categories, while the paper’s bound empirical claim is the primary median recorded in the JSON.
A median is robust to isolated extremes relative to an arithmetic mean, but it remains only a distribution summary. It does not reveal when the low-capture observations occurred, how much solar energy was involved, how capture varies within a day, or whether vehicles were connected. Equal treatment of records is not the same as weighting by generation volume or addressable EV load.
The phrase “smart charging” does not describe an optimizer used here. No schedule is fitted and no counterfactual is run. There is no baseline charging pattern, no departure constraint, and no network model. The method identifies market-value conditions that could motivate a future constrained charging experiment.
Nor is the capture rate an emissions factor. Low-price solar-shaped hours may have a high operational low-carbon share, but the environmental consequence of new demand requires a separate accounting method. Low-carbon share is an operational proxy, not lifecycle marginal emissions.
Results
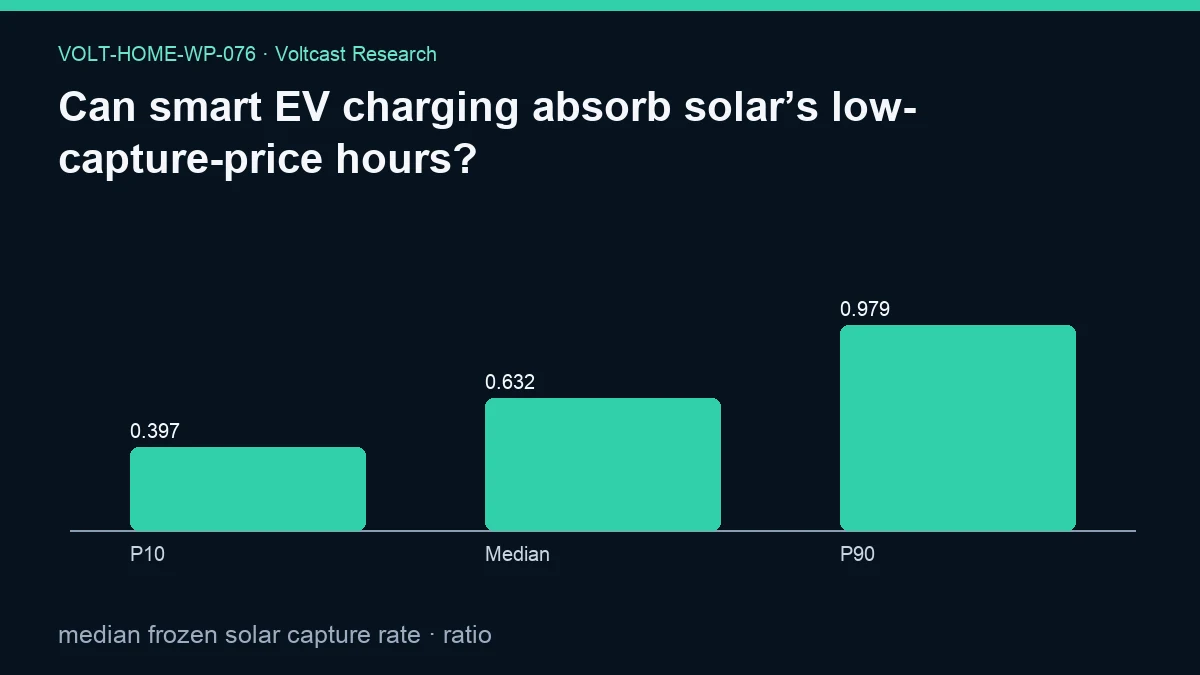
The median frozen solar capture rate is 0.632, based on 224 observations. The evidence interpretation says that a lower capture rate identifies solar-heavy low-price periods that flexible EV load could absorb. We retain “could” as a hypothesis rather than converting it into a measured absorption result.
The statistic documents a market-value gap: solar-shaped production received a median capture rate below the reference represented by a ratio of one. The evidence does not state the associated energy quantity, fleet capacity, or effect of demand response, so no absorbed MWh or changed price is reported.
The result also does not compare smart charging with unmanaged charging. It cannot state that a household saves money or reduces emissions. It reports no lifecycle marginal emissions and no measured household emissions. Its status is measured for the capture-rate diagnostic, not for the title’s physical system claim.
The figure labels are “P10,” “Median,” and “P90,” with frozen solar capture-rate values 0.39689, 0.632, and 0.97929, rendered as 0.397, 0.632, and 0.979. These are distribution quantiles, not EV absorption fractions. The evidence reports no bootstrap interval and names the interval method “not reported for this estimand.”
Robustness and placebo checks
The paper-level evidence states that within-family Holm control applies to inferential claims and that this result is descriptive without an unadjusted significance claim. It reports no secondary results. It also provides no EV-specific placebo, alternative fleet scenario, or charging-capacity sensitivity. We do not imply that those tests were performed.
Robustness work for the capture metric could compare zones, seasons, weighting schemes, and frozen vintages. Robustness work for the absorption hypothesis would require multiple charging powers, availability windows, fleet penetrations, and network limits. A useful placebo could shift EV availability away from solar-shaped hours. These are future designs, not results in the evidence.
The frozen status filter and the provenance hashes are important integrity controls. They identify which capture records entered the statistic and prevent an updated dataset from being silently substituted. They do not validate an EV response that was not modeled.
Limitations
The most important limitation is explicit: charging capacity is not modeled. Without the size and timing of flexible demand, the paper cannot say whether solar’s low-capture-price hours can be materially absorbed.
The capture-rate sample is a set of frozen aggregate records. The primary outcome does not report generation-volume weighting, regional EV availability, distribution-network constraints, or coincident demand. The median conceals heterogeneity and timing.
Capture rate is a market-value ratio, not a household retail saving. A consumer’s bill depends on tariff pass-through, taxes, supplier margin, network charges, and device efficiency. None is included. This is not a household bill study.
The result is also not an environmental impact estimate. Low-carbon generation share is an operational proxy, not lifecycle marginal emissions. Average mix does not identify the marginal response to charging, and imports are not fully allocated. The study reports no measured household emissions, makes no causal claim, and is not trading advice.
Practical implication
The capture-rate result can be used as a trigger for better questions, not as a deployment claim. A charging system could look for interval-level overlap between vehicle availability and solar-shaped low-price periods, then enforce the vehicle’s energy and power constraints. It should measure how often the opportunity is actually feasible.
Any user-facing promise should be narrower than “absorbs solar.” A controller moves household demand; it does not prove that a specific generator’s output was otherwise curtailed or that market prices changed. An environmental label would also need an explicitly defined signal. Operational low-carbon share is not lifecycle marginal emissions.
Economically, the study provides no bill estimate. A future scenario would need the household’s retail contract and charging baseline. The current paper simply establishes that the frozen solar capture-rate median is low enough to motivate constrained, prospective testing.
Reproducibility
Retrieve the evidence JSON for VOLT-HOME-WP-076 and verify its slug, measured status, assumption, primary metric, publication cutoff, source contracts, and all five provenance hashes. Filter frozen capture records to solar technology with a non-null capture rate and calculate the median. The archived result should be 0.632 from 224 records.
Changing the status filter, weighting by production, adding another technology, or constructing an EV schedule is not a reproduction of the primary metric. Each is a new analysis that requires its own assumptions and evidence artifact.
The public JSON and figure disclose aggregate evidence only. Use and redistribution of underlying source records remain governed by the registered licensing reference.
Disclosure
Analysis and drafting were model-assisted. This working paper is not peer reviewed. It is not a household bill study, not an EV-fleet simulation, not a causal absorption study, and not trading advice. Volt has no live traders or live capital. It reports no measured household emissions. Low-carbon generation share is an operational proxy and not lifecycle marginal emissions.
References
- International Energy Agency — Electricity 2026
- ACER and CEER — Rewarding flexibility: How retail contract choice can help unlock consumer flexibility
- International Energy Agency — Scaling Up Demand Flexibility
- European Commission — Communication from the Commission on the Citizens Energy Package
- Voltcast — Voltcast data licensing and redistribution