Do smart-home savings survive the 2021–2022 crisis regime?
Do smart-home savings survive the 2021–2022 crisis regime. Crisis regimes amplify both flexibility value and exposure; robust conclusions must survive both samples.
Abstract
This working paper compares the mean daily wholesale price range in 2021–2022 with the mean range in 2025–2026. The registered statistic is crisis minus recent. Its frozen value is -196.01532262037645 EUR/MWh, based on 30,287 crisis-sample observations. The negative sign means that the 2021–2022 mean daily maximum-minus-minimum range is lower than the 2025–2026 mean by 196.0153 EUR/MWh in the implemented sample. This sign conflicts with the evidence JSON’s supplied interpretation that crisis regimes amplify flexibility value and exposure; the numeric result and code-defined contrast take precedence in this paper. The study does not compute a smart-home schedule, customer saving, or retail bill. It therefore cannot establish whether savings “survive.” Any monetary interpretation is a declared synthetic wholesale scenario only. The family assumptions of 4,000 kWh annual consumption and 35% flexible energy do not enter the primary EUR/MWh range comparison. Taxes, network charges, supplier margin, VAT, device efficiency, degradation, customer behavior, and telemetry are excluded.
Plain-language answer
The frozen evidence does not directly answer whether smart-home savings survived the 2021–2022 crisis. It measures daily wholesale price ranges, not savings. Its crisis-minus-recent value is negative €196.0153/MWh. Under the implemented subtraction, that means the average daily range in the 2021–2022 subset is smaller than the average daily range in the 2025–2026 subset by that amount.
This matters because the evidence also contains a sentence saying crisis regimes amplify both flexibility value and exposure. That sentence is not consistent with the reported sign if “amplify” means a larger mean daily range in 2021–2022. We do not reverse the sign, relabel the periods, or manufacture a positive crisis story. A future audit may explain the mismatch, but the public paper reports it.
Even a correctly measured daily range is only an upper-bound signal. A smart home needs a forecast, controllable load, device availability, and a feasible schedule to use that spread. Retail charges and device losses can further change the result. Every euro figure here is a synthetic wholesale scenario metric, never a measured customer saving or retail bill.
Research question
The broad question asks whether household automation retains economic value during an exceptional wholesale-price regime. The registered implementation narrows it to a descriptive regime contrast: mean daily maximum-minus-minimum wholesale price range in 2021–2022 minus the same mean in 2025–2026.
The calculation does not estimate an automation treatment effect. There is no “smart” schedule and no unmanaged control. It does not compare bills before and after installing equipment. “Survive” can only be interpreted as whether the raw daily range proxy remains or changes across periods, and even that requires careful attention to the negative contrast.
Data and provenance
The analysis uses a frozen SELECT-only production snapshot with no customer telemetry. The tariff family registers day_ahead_prices, forecast_accuracy, bess_index_daily, zone_load, and zone_holidays. The primary statistic uses daily maximum and minimum day-ahead prices. The evidence reports a primary sample size of 30,287, corresponding to the crisis-side range collection used by the outcome.
The overall daily-price window runs from 2021-01-01 through 2026-08-29. The crisis subset includes records whose local-date year is 2021 or 2022. The recent subset includes years 2025 and 2026, with 2026 ending at the publication cutoff rather than a complete calendar year. The corpus also records detailed intervals from 2025-10-01 through 2026-08-29 and a long-history boundary from 2015-01-01 through 2026-08-29. Publication cutoff is 2026-08-30T00:00:00Z.
The source snapshot SHA-256 is 7e97489fc8528c8cc8c38830e05b48d949ce1f67b98575dff26f5d7c321e4c67. The protocol hash is adb36bf6b447af9f96339249b8becaefc20422499cca1977242866347a97bd4b; the paper-registry hash is 7bcb91d7476d0a69fe9fa75a5c7782f8117e0153f82f9112b7e1d307d3943717; the source-registry hash is 07949550ac443ff673fda5c0209b99f137544f3ffecf6775f109bb9d09663bd6; and the analysis-code hash is 57c57de79cdab2b5b6d6c54c485cb5162598c5ba0b0bfe995da40d75e6c52ba9. The evidence-manifest hashes are 55f628659ed0c1e30ab789a87ce2348e75a96b40e0738f99b2e98e9e88fe4ef6 for the JSON and 8d20f42789be79a892b28582174ceca9bcd635887e02a2a643023a2d6f2e7716 for the WebP figure. Extraction used a read-only transaction with a 180-second timeout. The five registered references are contextual and do not supply the regime contrast.
Method
For each included daily-price record, the analysis computes:
maximum day-ahead price - minimum day-ahead price.
It assigns the resulting range to the crisis group when the local-date year is 2021 or 2022. It assigns it to the recent group when the year is 2025 or 2026. It calculates the arithmetic mean in each group and reports:
mean crisis daily range - mean recent daily range.
A positive value would mean larger mean daily ranges in the crisis subset. A negative value means larger mean daily ranges in the recent subset. The metric remains in EUR/MWh because it is a difference between wholesale price ranges.
The family assumptions declare a 4,000 kWh annual synthetic household, 35% flexible energy, wholesale pass-through, and no customer telemetry. Neither annual load nor the flexible share is used in this primary contrast. There is no conversion to annual synthetic household euros.
No scheduling model determines whether a flexible load can move from the maximum-price interval to the minimum-price interval. No forecast is used. No EV charger, battery, or heat pump is modeled. Battery round-trip efficiency, degradation, and state of charge are absent; EV efficiency and connection windows are absent; heat-pump COP and comfort are absent. Taxes, network charges, VAT, supplier margin, fixed fees, and device losses are excluded. Any monetary extension must be declared a synthetic wholesale scenario.
Results
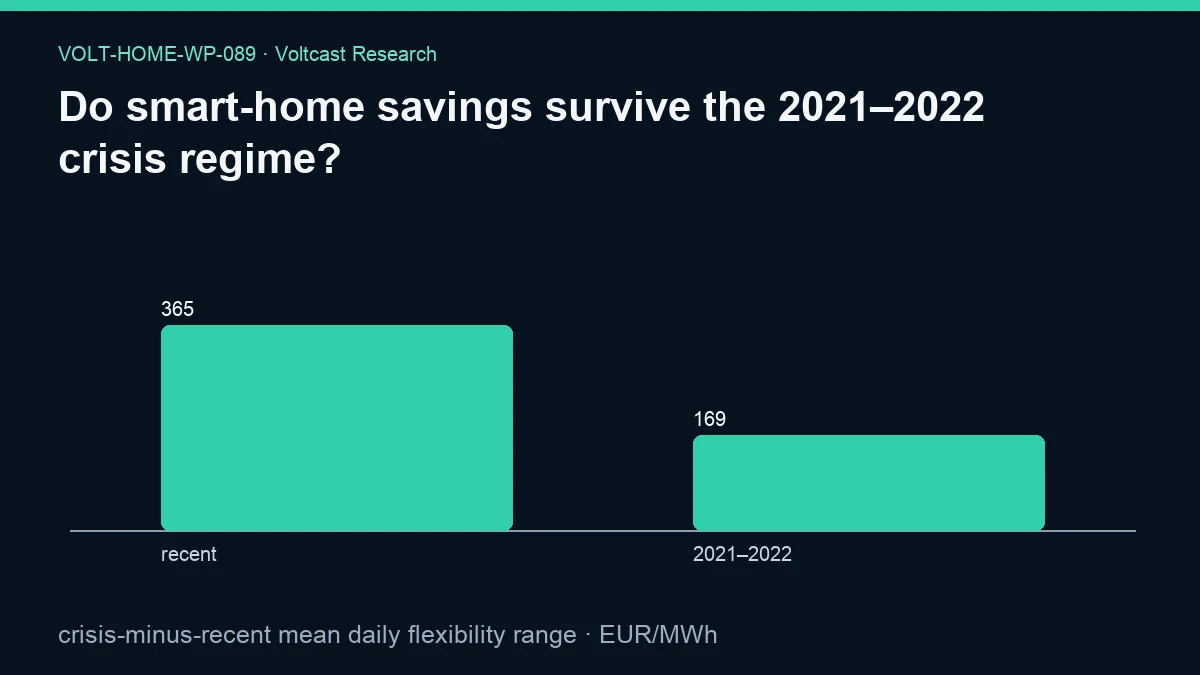
The primary result is -196.01532262037645 EUR/MWh for crisis minus recent mean daily range. Rounded, the 2021–2022 mean range is 196.02 EUR/MWh lower than the 2025–2026 mean range in the frozen implementation. The evidence reports 30,287 crisis observations.
The sign is the central result. It does not support the claim that the crisis subset has a larger mean daily flexibility range than the recent subset. The accompanying JSON interpretation says crisis regimes amplify both flexibility value and exposure, but that statement is inconsistent with the defined subtraction and negative value. We preserve the inconsistency as an audit issue and follow the computed metric.
The result also does not show that smart-home savings disappear. Daily ranges can be positive in both periods while their means differ. More importantly, no savings are calculated. A feasible smart-home schedule might use a different fraction of the range in each regime.
The figure values are exactly 364.95837904722623 EUR/MWh for the recent group and 168.94305642684978 EUR/MWh for 2021–2022, consistent with the registered crisis-minus-recent contrast of -196.01532262037645 EUR/MWh. The regenerated evidence reports bootstrap_95_interval: null and interval_method: "not reported for this estimand", so no confidence interval is claimed. Every EUR/MWh number is a synthetic wholesale scenario metric, not a customer saving or retail bill.
Robustness and placebo checks
The first audit check is to reverse the subtraction deliberately. Recent minus crisis should equal the positive counterpart of the registered value. This is an arithmetic identity and helps detect accidental label reversal. The public metric remains crisis minus recent.
A period-balance check should compare complete calendar years. The 2026 recent subset ends on 2026-08-29, making its seasonal composition incomplete. Restricting both regimes to matched months or using 2025 alone would test whether the sign is driven by month coverage. Those results are not in the frozen evidence and are not claimed.
A zone-composition robustness check should require the same zones in both periods and either weight zones equally or report each zone separately. Expanding market coverage over time can change a pooled mean even if within-zone behavior does not. The current paper does not report coverage balance.
A feasible-dispatch test would apply one frozen device and load specification to both periods. It would include interval duration, forecast availability, automation failure, and physical constraints. Only then could “smart-home value” be compared. A retail robustness test would add complete tariffs and retain the synthetic label.
Within the ten-paper family, Holm correction governs inferential claims, and blocked day or week bootstrap intervals preserve serial dependence. This paper reports a descriptive contrast and does not infer significance, especially because the attached bootstrap field is not an interval for that contrast.
Limitations
The metric is not savings. It is the difference between two pooled means of raw daily wholesale ranges. The title’s smart-home framing exceeds what the implementation directly measures.
The crisis and recent periods are not symmetric. They contain different years, and 2026 is partial. Market-zone coverage may differ, but the evidence does not provide a balanced-panel result. The analysis also does not control for season, holidays, interval resolution, or structural changes.
The supplied interpretation conflicts with the numeric sign and metric definition. This could indicate a generic interpretation template, a label issue, or another implementation problem, but the available evidence does not establish which. Until corrected through a new governed artifact, the negative registered result is authoritative for this paper.
The 4,000 kWh annual load and 35% flexibility assumptions are unused. No household profile, asset, efficiency, battery degradation, comfort, mobility, or controller appears. Taxes, VAT, network charges, supplier margin, and device losses are excluded. Thus, even a synthetic annual household amount is not computed.
The evidence reports no interval for the primary contrast. Historical range differences do not forecast future regimes, and raw ranges overstate accessible value when extremes are brief or unavailable to the device.
Practical implication
Do not use a broad “crisis increases flexibility value” narrative without checking the sign and period construction. The frozen result says the opposite for mean daily ranges: recent exceeds crisis by 196.0153 EUR/MWh under the registered contrast.
For a decision-grade study, build matched zone-year panels, compare complete seasonal windows, and run the same feasible household schedule in each regime. Include efficiency, degradation or comfort, automation, forecasts, and the full tariff. Report all euro outcomes as synthetic scenarios unless actual bills are measured.
Reproducibility
Verify the evidence JSON’s ID, title, slug, assumptions, status, cutoff, source contracts, all five provenance hashes, and the evidence-manifest hashes for the JSON and figure. Confirm the transaction was read-only and the snapshot hash matches the manifest.
For every frozen daily row, compute maximum minus minimum price. Select local-date years 2021 and 2022 for crisis and 2025 and 2026 for recent. Compute each arithmetic mean, then subtract recent from crisis. The result should reproduce -196.01532262037645 EUR/MWh.
Reproduction must preserve local-date year assignment and the 2026 cutoff. Matching months, balancing zones, changing the period, or using feasible dispatch are new robustness studies. They should not overwrite this signed contrast.
Disclosure
Analysis and drafting were model-assisted. This public working paper is not peer reviewed. It explicitly discloses the conflict between the supplied interpretation and the computed negative result. It is not financial, tariff-selection, investment, purchasing, or trading advice.
No customer saving or retail bill is measured. Every monetary statement is a declared synthetic wholesale scenario. Volt has no live traders or live capital; C0R is the only paper strategy, and this regime comparison is not trading research.
References
- Advances in Applied Energy, Assessing the conditions for economic viability of dynamic electricity retail tariffs for households.
- ACER and CEER, Rewarding flexibility: How retail contract choice can help unlock consumer flexibility.
- European Commission, Communication from the Commission on the Citizens Energy Package.
- Energy Policy, Welfare redistribution through flexibility — Who pays?.
- International Energy Agency, Scaling Up Demand Flexibility.