What does bill value-at-risk reveal that average savings hide?
What does bill value-at-risk reveal that average savings hide. Tail exposure reveals risk hidden by average savings.
Abstract
Average wholesale cost can conceal the size of expensive days. This working paper therefore measures a tail-distance statistic for a standardized synthetic household: the 95th-percentile daily wholesale energy cost minus the median daily wholesale energy cost. The frozen calculation allocates 4,000 kWh evenly across 365 days and values that daily quantity at each observed zone-day mean price. Across 93,161 observations, the reported value-at-risk-above-median is €3.708109589 per day. This is a declared synthetic wholesale scenario, not a customer bill, measured customer saving, retail loss, or product quote. Taxes, VAT, network charges, supplier margin, tariff fees, device losses, and household load shape are excluded. Although the family assumptions declare 35% flexible energy, that share does not enter this paper’s tail-cost formula; the metric values the full standardized daily energy quantity. The result shows that a single average is incomplete, while also demonstrating why the label “bill value-at-risk” requires careful qualification.
Plain-language answer
The frozen wholesale scenario says that its 95th-percentile day costs about €3.71 more than its median day for a synthetic household using 4,000 kWh per year at a perfectly flat daily energy allocation. That difference is the paper’s tail-risk measure. It makes expensive-day exposure visible even when an annual or average daily number looks manageable.
It is not a €3.71 retail-bill surcharge and not evidence that a customer loses or saves that amount. The calculation includes wholesale energy only. Real bills can contain taxes, VAT, network charges, supplier margin, fixed fees, risk premiums, caps, and other contract terms. Some components may be constant, some may vary by time, and some may dominate the wholesale movement. A real household also uses more electricity on some days than others. Because the scenario fixes daily energy at 4,000 divided by 365 kWh, it does not capture a cold day on which both consumption and wholesale prices are high.
The useful answer is therefore qualitative and quantitative at once: tail exposure matters, and in this specific synthetic wholesale construction its P95-minus-median distance is €3.708109589 per day. A household budgeting decision still needs its own load profile and complete tariff.
Research question
The registered question asks what a tail-risk statistic reveals that an average “savings” number hides. We operationalize that question without claiming observed savings. The estimand is the distance between two points in the distribution of synthetic daily wholesale costs: the median and the 95th percentile.
This statistic addresses dispersion, not expected value. Two price samples can have the same mean but different P95-minus-median distances. The one with the larger distance exposes a flat-load synthetic household to a more expensive upper tail. The study does not estimate the probability of financial distress, the affordability of a retail contract, or the causal protection offered by flexibility. Those require income, load, tariff, and behavioral information that is intentionally absent.
Data and provenance
The matching evidence uses a public-safe, SELECT-only production snapshot. No customer telemetry appears in the input or output. Its registered source contracts are day_ahead_prices, forecast_accuracy, bess_index_daily, zone_load, and zone_holidays. The primary calculation uses mean day-ahead prices from the daily price records. The evidence reports a sample size of 93,161 observations.
The declared daily-price window is 2021-01-01 through 2026-08-29. The broader corpus records detailed intervals from 2025-10-01 through 2026-08-29 and a long-history boundary from 2015-01-01 through 2026-08-29. The publication cutoff is 2026-08-30T00:00:00Z. This paper does not imply that every source table spans each of those windows or that every registered table contributes directly to the primary statistic.
Provenance is content-addressed. The source snapshot hash is 7e97489fc8528c8cc8c38830e05b48d949ce1f67b98575dff26f5d7c321e4c67. The preregistered protocol hash is adb36bf6b447af9f96339249b8becaefc20422499cca1977242866347a97bd4b, the paper-registry hash is 7bcb91d7476d0a69fe9fa75a5c7782f8117e0153f82f9112b7e1d307d3943717, the source-registry hash is 07949550ac443ff673fda5c0209b99f137544f3ffecf6775f109bb9d09663bd6, and the analysis-code hash is 57c57de79cdab2b5b6d6c54c485cb5162598c5ba0b0bfe995da40d75e6c52ba9. The evidence-manifest hashes are c19c43e5b7482f613ab1af939545a293e3004911abcde1ff1b01959c666cbfc5 for the JSON and f23e3ff9a31aa19145e6a7736440091e3c649b1ee35845ac399a8e94e6e77f0a for the WebP figure. Extraction used a read-only transaction and a 180-second statement timeout. The five registered references frame dynamic tariffs and flexibility; none supplies this paper’s empirical value.
Method
For every included daily-price record, the analysis takes the zone-day mean wholesale price and converts it to a synthetic daily energy cost:
mean wholesale price in EUR/MWh × 4,000 kWh ÷ 365 ÷ 1,000.
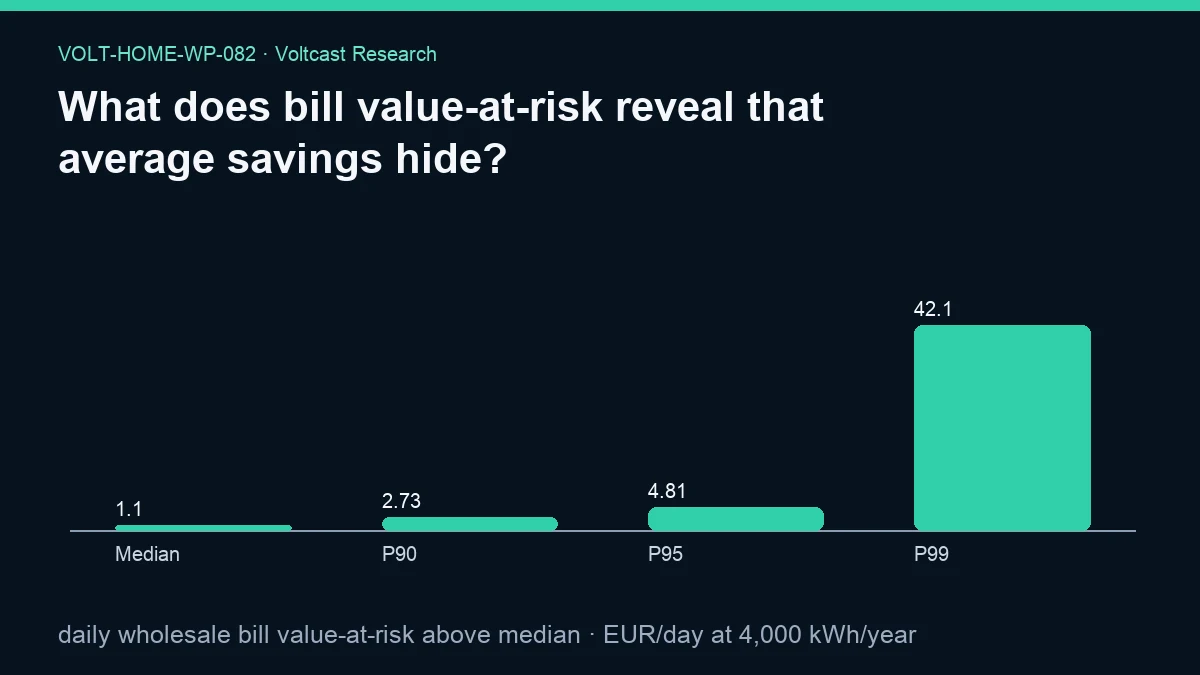
The factor 4,000/365 yields approximately 10.96 kWh per day. Dividing by 1,000 aligns kWh with the EUR/MWh price unit. The resulting collection is sorted. The median, P90, P95, and P99 values form the figure, while the primary statistic subtracts the median from P95.
Despite the paper family’s general assumption of 35% flexible energy, the implemented formula does not multiply by 0.35. It values the full standardized daily quantity. The result is therefore exposure for a flat daily wholesale-energy scenario, not the risk remaining after optimization of a flexible share. No baseline contract is subtracted, and no savings series is constructed. The term “bill” in the metric name is shorthand for the synthetic wholesale energy component only.
There is no appliance dispatch. Battery capacity, inverter power, round-trip efficiency, and degradation are not applicable to the computation because no battery is modeled. EV charger power, charging efficiency, and connection windows are absent. Heat-pump COP, thermal dynamics, and comfort are absent. Likewise, no taxes, network tariff, VAT, supplier spread, fixed fee, hedge premium, cap premium, or bad-debt allocation is added. These omissions make the statistic transparent, but they prevent direct retail interpretation.
The method is descriptive. It does not fit a predictive model or infer a causal effect. It pools the available zone-day observations and estimates quantiles of that pooled synthetic-cost distribution.
Results
The primary result is €3.7081095890410958 per day at 4,000 kWh per year. Rounded, P95 is €3.71 per synthetic day above the median synthetic day. Every monetary value here is a declared synthetic wholesale scenario. It is never a measured customer saving, customer loss, or retail bill.
This distance demonstrates the specific information that an average omits: location in the upper tail. The result does not say that 5% of customers pay €3.71 extra. The sample units are market zone-days, not customers. It also does not say the P95 daily cost itself equals €3.71; the metric is P95 minus the median.
The figure values are exactly €1.1019364383561645, €2.726372602739726, €4.81004602739726, and €42.09422969863003 for the median, P90, P95, and P99 daily synthetic wholesale costs. The regenerated evidence reports bootstrap_95_interval: null and interval_method: "not reported for this estimand". The public conclusion therefore relies on the descriptive point statistic and asserts no interval estimate.
Most importantly, the result does not establish that flexibility reduces tail cost. No optimized and unoptimized schedules are compared. It establishes a tail-distance benchmark against which a future safeguard could be measured.
Robustness and placebo checks
A basic unit placebo sets every daily mean wholesale price to the sample median. All synthetic daily costs then coincide, so P95 minus median must equal zero. This verifies that the statistic responds to upper-tail variation rather than the annual-energy scaling itself.
A load-scaling check repeats the calculation with another declared annual energy level. Because the current method is linear in kWh, both the median, P95, and their difference should scale proportionally. That behavior is mathematically expected and should not be mistaken for evidence that larger households have proportionally identical retail risk; load timing can differ with household size and technology.
A more meaningful robustness study would preserve the same price records while replacing flat daily energy with several preregistered standardized load shapes. Winter-peaking electric heat, commuter EV charging, and flatter non-electric heating profiles could align differently with expensive days. That analysis was not run here, so this paper does not claim robustness to load-price correlation.
The relevant safeguard placebo is a fixed wholesale-price path. A genuine fixed-price component would remove day-to-day wholesale variation from the covered share, but the premium and contract terms would need explicit modeling. Simply truncating or replacing observations after seeing the sample would be post hoc.
Within the tariff-economics family, Holm correction governs inferential claims and blocked day or week bootstrap intervals are required to respect serial dependence. This result is descriptive and makes no unadjusted significance claim. The observation count does not turn correlated zone-days into independent household outcomes.
Limitations
The strongest limitation is nomenclature. “Bill value-at-risk” sounds like an all-in retail measure, but the actual series is a synthetic wholesale energy-cost component. It excludes taxes, VAT, supplier margin, network charges, fixed charges, risk premia, and all contractual adjustments. Those exclusions are not small implementation details; they change both the level and potentially the timing of a retail bill.
The daily energy quantity is flat. Real consumption is seasonal and weather-sensitive. A high-price day can coincide with high electric heating demand, magnifying exposure, or with low demand, reducing it. The scenario cannot represent either pattern. It also pools zones and dates rather than estimating a named household’s local distribution.
The registered 35% flexible-energy assumption is not used by the primary formula. Readers should not infer that the reported tail distance is after 35% of load has been optimized. No optimization occurs. There is also no forecast: the statistic is computed from observed daily means. A prospective budget based on forecasts could be miscalibrated even if this historical distribution were stable.
No asset assumptions apply because assets are absent. There is no efficiency, degradation, power, capacity, comfort, or availability model. No customer telemetry is used, which protects the public evidence boundary but limits personalization. Finally, the evidence reports no uncertainty interval for the primary metric.
Practical implication
Average synthetic wholesale cost should be accompanied by at least one upper-tail measure. P95 minus median is easy to explain, but it should be labeled as a scenario statistic and shown beside the absolute median and P95 rather than alone.
For practical household budgeting, recompute the distribution using the household’s local bidding zone, historical or scenario load shape, complete retail tariff, and any hedged or capped share. Then test whether a proposed flexibility rule reduces the upper tail without creating unacceptable comfort, mobility, efficiency, or degradation costs. This paper provides a benchmark, not that completed decision.
Reproducibility
Start from the evidence JSON referenced in the frontmatter and verify the stable ID, title, slug, status, assumptions, source tables, publication cutoff, all five provenance hashes, and the evidence-manifest hashes for the JSON and figure. Confirm that the evidence is marked read-only and that the snapshot hash matches the series manifest.
For each frozen daily-price row, multiply mean_price by 4,000, divide by 365, and divide by 1,000. Sort the resulting values. Compute the median and 95th percentile using the quantile convention in the content-addressed analysis code. Subtract median from P95. The output should reproduce 3.7081095890410958 EUR/day at 4,000 kWh/year. The figure additionally requires median, P90, P95, and P99 of the same series.
Changing the quantile interpolation rule, date cutoff, annual load, zone inclusion, or daily load shape creates a new result. Adding retail charges or flexibility optimization also creates a new scenario and must not be presented as reproduction of this one.
Disclosure
Analysis and drafting were model-assisted. The evidence, code hash, assumptions, source registry, and limitations are public. This working paper is not peer reviewed. It is not financial, investment, tariff-selection, purchasing, or trading advice.
All euro-denominated results are synthetic wholesale scenarios, never customer savings or retail bills. Volt has no live traders or live capital; C0R is the only paper strategy. This consumer-safeguard analysis is not trading research or promotion.
References
- Advances in Applied Energy, Assessing the conditions for economic viability of dynamic electricity retail tariffs for households.
- ACER and CEER, Rewarding flexibility: How retail contract choice can help unlock consumer flexibility.
- European Commission, Communication from the Commission on the Citizens Energy Package.
- Energy Policy, Welfare redistribution through flexibility — Who pays?.
- International Energy Agency, Scaling Up Demand Flexibility.