Does a Dunkelflaute increase the value of household flexibility?
Does a Dunkelflaute increase the value of household flexibility. The bottom-decile solar-and-wind proxy is transparent but not a meteorological Dunkelflaute definition.
Abstract
This working paper compares daily price variability on zone-days with both solar share and wind share in their pooled bottom deciles against all other paired zone-days. The frozen evidence labels the selected rows a Dunkelflaute proxy but explicitly states that the rule is not a meteorological Dunkelflaute definition. Across 1,977 selected observations, the reported difference in mean daily price standard deviation is -15.1460848538313 EUR/MWh standard deviation, calculated as proxy days minus other days.
The negative contrast does not show an increase in household-flexibility value. No EV, battery, heat pump, flexible load, retail tariff, or counterfactual schedule is modeled. The metric is daily price dispersion rather than achievable household savings. It also does not estimate environmental impact. Low-carbon generation share in this family is an operational proxy, not lifecycle marginal emissions, and no measured household emissions appear. The defensible conclusion is that this bottom-decile solar-and-wind screen had lower, not higher, daily price standard deviation in the pooled frozen panel; the title’s broader value claim remains unanswered.
Plain-language answer
Not according to the narrow proxy used here. Days with both solar and wind shares in the bottom deciles had a daily price-standard-deviation contrast of -15.1460848538313 EUR/MWh standard deviation relative to other days. Because the calculation is proxy days minus other days, the negative value means the selected group had lower average daily price variability under this measure.
That is not the same as saying household flexibility was less valuable. Flexibility value depends on the intervals a device can move between, its physical constraints, the price spread it can capture, and the customer’s tariff. None of those is modeled. A daily standard deviation is only a rough market-shape diagnostic.
The selected rows are also not a validated meteorological Dunkelflaute set. They are a transparent bottom-decile screen on observed solar and wind generation shares. No causal or emissions conclusion follows.
Research question
The registered question asks whether a Dunkelflaute increases the value of household flexibility. The measured question is: how does mean daily price standard deviation differ between rows where observed solar and wind shares are each at or below their pooled bottom-decile thresholds and all remaining paired rows?
The implemented question contains two proxies. The event proxy uses low observed generation shares rather than a meteorological definition involving weather extent, persistence, or geographic coverage. The value proxy uses daily price standard deviation rather than a constrained household counterfactual. Both choices are transparent, but neither should be mistaken for the concept in the title.
The study is observational. It cannot establish whether low renewable output caused the observed price shape, and it cannot determine whether a household action would be more valuable during the selected rows.
Data and provenance
The evidence JSON linked in the frontmatter is the canonical paper aggregate. The registered source contracts are generation_mix, day_ahead_prices, capture_stats, res_accuracy, and zone_temp_weighted. The primary calculation uses observed solar share, observed wind share, and daily price standard deviation from paired zone-day records.
The evidence lists daily-price data from 2021-01-01 through 2026-08-29, detailed intervals from 2025-10-01 through 2026-08-29, and long history from 2015-01-01 through 2026-08-29. Its publication cutoff is 2026-08-30T00:00:00Z. Extraction ran as a read-only transaction with a statement timeout of 180 seconds.
The snapshot SHA-256 is 7e97489fc8528c8cc8c38830e05b48d949ce1f67b98575dff26f5d7c321e4c67. The analysis-code hash is 57c57de79cdab2b5b6d6c54c485cb5162598c5ba0b0bfe995da40d75e6c52ba9, protocol hash adb36bf6b447af9f96339249b8becaefc20422499cca1977242866347a97bd4b, paper-registry hash 7bcb91d7476d0a69fe9fa75a5c7782f8117e0153f82f9112b7e1d307d3943717, and source-registry hash 07949550ac443ff673fda5c0209b99f137544f3ffecf6775f109bb9d09663bd6.
The source contract includes no household load, bill, device constraints, or measured household emissions. Contextual source links are reproduced exactly in References without adding external numeric findings.
Method
The analysis creates paired rows for which a daily-price record and finite low-carbon-share components are available. It calculates the pooled bottom-decile threshold separately for observed solar share and observed wind share. A row enters the proxy group when both shares are at or below their respective thresholds. All rows exceeding at least one threshold form the comparison group.
For each group, the analysis takes the mean of daily price standard deviation. The reported contrast subtracts the comparison-group mean from the proxy-group mean. Its unit is stated as EUR/MWh standard deviation. The selected group contributes 1,977 observations.
This method does not require a subjective event list, but it does not encode duration or meteorology. A single low-share zone-day can qualify without representing a broad, persistent weather event. The pooled thresholds can also select different absolute conditions across zones.
The method does not value flexibility. There is no baseline load, movable energy, power limit, efficiency, comfort constraint, or tariff. Daily price standard deviation is only a dispersion summary. The environmental variables are operational generation shares, not lifecycle marginal emissions, and the analysis does not estimate marginal response.
Results
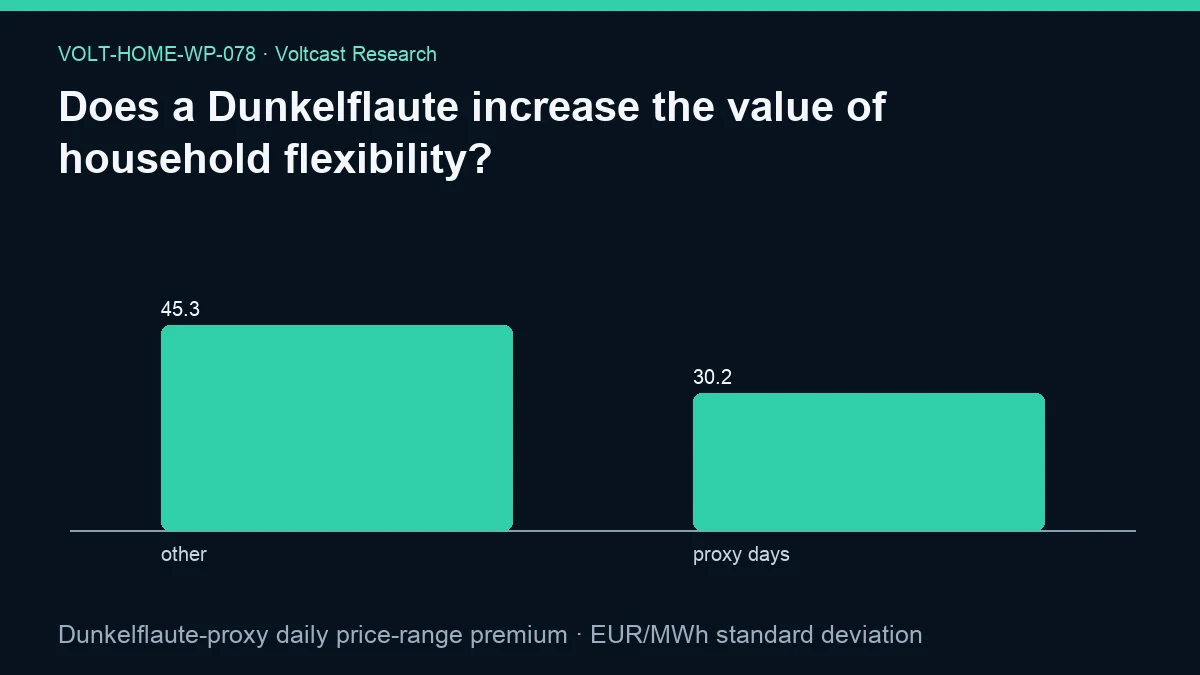
The primary metric is “Dunkelflaute-proxy daily price-range premium.” The recorded value is -15.1460848538313 EUR/MWh standard deviation over 1,977 proxy observations. Under the calculation’s sign convention, the selected rows have lower mean daily price standard deviation than the other rows.
The evidence interpretation emphasizes that the bottom-decile solar-and-wind proxy is transparent but not a meteorological Dunkelflaute definition. The negative result therefore applies only to this screen and this price-dispersion outcome. It does not refute every possible relationship between meteorological Dunkelflaute events and household flexibility.
Most importantly, no flexibility value is measured. The statistic is not household savings, avoided cost, comfort value, or battery revenue. It also is not an emissions result. The study makes no causal claim and reports no measured household emissions.
The figure labels are “other” and “proxy days,” with mean daily price-standard-deviation values 45.33717372585963 and 30.191088872028327, rendered as 45.3 and 30.2. Proxy days minus other reproduces the -15.1460848538313 primary contrast. The evidence reports no bootstrap interval and names the interval method “not reported for this estimand.”
Robustness and placebo checks
The paper-level evidence states that within-family Holm control applies to inferential claims and that the result is descriptive with no unadjusted significance claim. It records no secondary results and no paper-specific placebo. We therefore do not claim that the negative contrast is statistically significant, stable across thresholds, or validated by meteorological events.
Robustness work would vary the low-output threshold, require event persistence, separate zones and seasons, compare price range with standard deviation, and test demand-weighted results. A meteorological validation would independently classify weather events before reading price outcomes. A household-value study would simulate declared devices and include a non-event control.
None of those outputs exists in the frozen evidence. The completed checks are provenance and determinism: the registry, snapshot, analysis code, evidence, and figure identify the original proxy calculation. That guards against silent specification changes but not against conceptual limitations.
Limitations
The event definition is not meteorological. It uses observed bottom-decile solar and wind shares. Generation can be affected by installed capacity, curtailment, outages, and reporting coverage as well as weather. The rule does not require geographic breadth or persistence.
The outcome is not flexibility value. Daily price standard deviation can miss the timing and direction of usable spreads. A constrained household may be unable to move demand between the relevant intervals. Retail charges can further alter value.
The panel is pooled and unweighted. Zone composition, seasonal patterns, and data availability may influence both event classification and price dispersion. No causal control design is included.
Operational low-carbon generation share is not lifecycle marginal emissions. Imports are not fully allocated, and marginal dispatch is not measured. This is not a household bill study, contains no actual customer data, and reports no measured household emissions. It is not trading advice.
The calculation also does not distinguish flexibility that shifts energy within a day from flexibility that can bridge several days. A persistent low-output event and a single qualifying zone-day may create very different feasible choices for an EV, battery, or heat pump. Because duration is absent from the proxy definition, the result cannot compare those forms of flexibility or their constraints.
Practical implication
A home-energy controller should not hard-code “Dunkelflaute equals high flexibility value” from this evidence. It should use the actual forward price curve, device constraints, and local availability for each decision. If a weather-event label is shown, its definition should be explicit and independently validated.
The negative proxy contrast also demonstrates why intuitive narratives need measurement. A low-wind, low-solar label does not mechanically imply greater within-day dispersion in every pooled sample. But the result should not be turned into the opposite universal rule either.
Environmental claims require separate care. The observed shares are operational proxies, not lifecycle marginal emissions. A controller cannot claim measured emissions savings from this analysis. Household bill effects and comfort or mobility constraints remain outside scope.
Reproducibility
Retrieve the evidence JSON for VOLT-HOME-WP-078 and verify paper ID, slug, measured status, primary metric, source contracts, cutoff, and all five provenance hashes. Build the paired panel, calculate pooled bottom-decile thresholds for solar and wind shares, classify rows meeting both conditions, and compare mean daily price standard deviation as selected minus other.
The frozen result is -15.1460848538313 EUR/MWh standard deviation with 1,977 selected observations. Adding persistence, meteorological data, geographic coverage, another dispersion measure, or a household optimization changes the estimand and requires a new evidence record.
The public figure and JSON are aggregate artifacts; source use remains governed by the licensing reference.
Disclosure
Analysis and drafting were model-assisted. This working paper is not peer reviewed. It is not a meteorological event validation, not a household bill study, not a causal flexibility-value study, and not trading advice. Volt has no live traders or live capital. It reports no measured household emissions. Low-carbon generation share is an operational proxy, not lifecycle marginal emissions.
References
- International Energy Agency — Electricity 2026
- ACER and CEER — Rewarding flexibility: How retail contract choice can help unlock consumer flexibility
- International Energy Agency — Scaling Up Demand Flexibility
- European Commission — Communication from the Commission on the Citizens Energy Package
- Voltcast — Voltcast data licensing and redistribution