Does a higher renewable share reduce—or increase—short-run price volatility?
Does a higher renewable share reduce—or increase—short-run price volatility. More renewable output may lower means while increasing short-run shape; this is observational.
Abstract
This working paper examines whether daily price variability is associated with the observed low-carbon share of generation. In the frozen Voltcast panel, the Pearson correlation between low-carbon generation share and daily price standard deviation is -0.10819031240897514 across 44,437 paired observations. The result is a weak negative association: higher shares coincide, on average, with slightly lower daily price variability in this pooled descriptive measure. It does not establish that renewable output causes volatility to fall, nor does it exclude different relationships within particular zones, seasons, or intraday shapes.
The registered title says renewable share, while the frozen metric uses low-carbon share. Those labels are not automatically identical. The environmental field is an operational generation proxy, not lifecycle marginal emissions. It does not fully allocate imports and cannot identify the emissions response to household demand. This study is not a causal design, a household bill model, or an estimate of measured household emissions. Its contribution is a bounded panel association and a clear statement of what remains unidentified.
Plain-language answer
In this dataset, days with a higher low-carbon generation share tended to have marginally lower price variability, not higher variability. The reported Pearson r is -0.10819031240897514. Because the relationship is weak, it should not be turned into a rule that more low-carbon output stabilizes prices. A great deal of daily variation is not summarized by this one association.
The measure of “volatility” here is the daily standard deviation of recorded prices. It is not household bill volatility, forecast uncertainty, or market risk over an investment horizon. The generation variable is low-carbon share as represented in the operational data, not a complete renewable-only measure and not lifecycle marginal emissions.
The practical answer is therefore conditional: this pooled snapshot does not support a simple claim that higher low-carbon share increases short-run daily price variability. It also does not prove that such output reduces volatility.
Research question
The title poses a directional choice: does a higher renewable share reduce or increase short-run price volatility? The implemented question asks whether low-carbon generation share and within-day price standard deviation have a linear association across paired zone-days. The reported estimand is Pearson correlation.
Three boundaries matter. First, “low-carbon” is the measured field; “renewable” is broader title language. Second, “short-run volatility” is operationalized as daily price standard deviation, not a stochastic-volatility model. Third, the design is observational. It does not manipulate generation share or isolate exogenous variation.
The result can describe whether two daily summaries tend to move together. It cannot determine whether generation mix caused the price shape, whether prices affected dispatch, or whether both responded to demand, weather, fuel, or network conditions. It also cannot determine the emissions effect of shifting household consumption.
Data and provenance
The public evidence file named in the frontmatter is the result of record. It declares the family contracts generation_mix, day_ahead_prices, capture_stats, res_accuracy, and zone_temp_weighted. The primary calculation pairs low-carbon share derived from generation records with price_std from matching daily-price records.
The data-window metadata lists daily prices from 2021-01-01 through 2026-08-29, detailed intervals from 2025-10-01 through 2026-08-29, and long history from 2015-01-01 through 2026-08-29. The frozen publication cutoff is 2026-08-30T00:00:00Z. The database transaction was read-only and used a statement timeout of 180 seconds.
Provenance is bound by five hashes: snapshot f77e3ae328f93916e53b1bab7516e1d0ac740a0dbf424cd2b73c81fee2559318, analysis code 57c57de79cdab2b5b6d6c54c485cb5162598c5ba0b0bfe995da40d75e6c52ba9, protocol adb36bf6b447af9f96339249b8becaefc20422499cca1977242866347a97bd4b, paper registry 7bcb91d7476d0a69fe9fa75a5c7782f8117e0153f82f9112b7e1d307d3943717, and source registry 07949550ac443ff673fda5c0209b99f137544f3ffecf6775f109bb9d09663bd6.
No household bills, meter traces, retail tariffs, or measured household emissions are included. The registered contextual sources appear exactly in the References section and do not supply additional numeric findings to this paper.
Method
The calculation iterates over available generation rows, obtains the matching zone-day price record, and retains records with a finite low-carbon share. Each paired observation contributes the share and the daily price standard deviation. Pearson correlation is computed across those two vectors.
Daily standard deviation compresses a price curve into one dispersion number. It captures whether prices within the represented day are tightly grouped or spread out around their daily mean. It does not distinguish one isolated spike from repeated swings, identify timing, or measure forecast error. Two days can have the same standard deviation and very different shapes.
The pooled correlation gives every retained zone-day one observation. No population, consumption, demand, or generation weighting is reported. There are no controls for season, zone, weather, load, fuel costs, outages, cross-border constraints, or changing market design. Consequently, the coefficient describes the assembled panel and is not a structural parameter.
The environmental input remains a low-carbon operational share. It is not lifecycle marginal emissions and does not fully assign imported electricity. The method neither estimates the marginal unit nor simulates an extra household load. No causal or measured-emissions conclusion is available.
Results
The primary result is -0.10819031240897514 Pearson r over 44,437 observations. The negative sign means higher low-carbon share is associated with lower daily price standard deviation in the pooled records. The magnitude is weak, so the result is better understood as limited inverse co-movement than as a predictive rule.
The frozen interpretation is: “More renewable output may lower means while increasing short-run shape; this is observational.” The primary numeric value itself is negative for the registered low-carbon-share-versus-price-standard-deviation metric. This paper therefore reports the sign as measured and avoids expanding the interpretation into a mechanism not identified by the evidence.
The coefficient does not say that every high-share day is calm, or that low-share days are volatile. It does not show the relationship by technology. It also does not measure carbon risk or household emissions. Low-carbon share is an operational proxy rather than lifecycle marginal emissions.
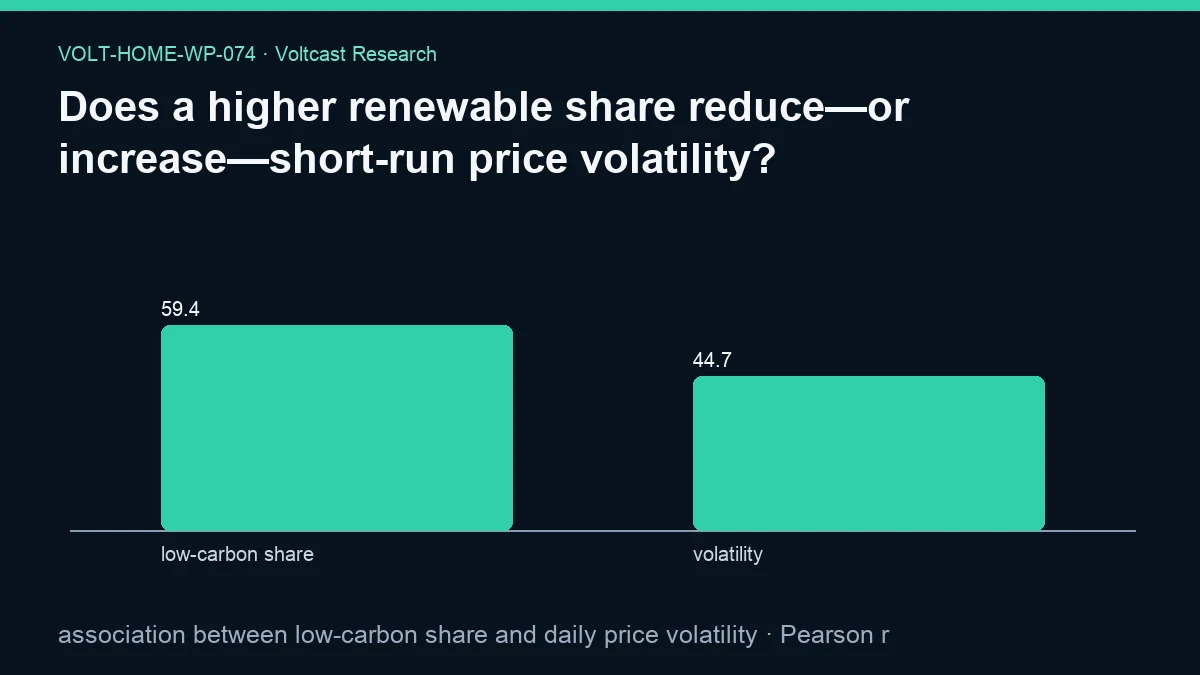
The figure labels are “low-carbon share” and “volatility,” with values 59.38346189343282 and 44.6633251367104, rendered as 59.4 and 44.7. Those values are input summaries on different scales, not the Pearson coefficient. The evidence reports no bootstrap interval and names the interval method “not reported for this estimand.”
Robustness and placebo checks
The family evidence states that within-family Holm control applies to inferential claims and that this descriptive result makes no unadjusted significance claim. The public JSON includes no secondary result and no paper-specific placebo output. We therefore report neither a p-value nor a claim that the observed association survives alternative specifications.
Relevant robustness checks would separate zones, seasons, and market-resolution regimes; compare standard deviation with range or robust dispersion; weight by demand; and distinguish wind, solar, hydro, nuclear, and other represented categories. Placebo checks could shift generation shares across dates or zones to test whether pairing carries information. Those are proposed analytical directions only. No such numbers are in the evidence.
The completed reproducibility check is the immutable linkage among registry, snapshot, code, evidence, and figure. That lineage prevents a later variant from being presented as the original result. It does not remove confounding or heterogeneity.
Limitations
The title-to-metric difference is material. “Renewable share” should not be substituted for “low-carbon generation share” without examining category definitions. The paper reports only the frozen low-carbon metric.
Price standard deviation is one summary of short-run shape. It loses timing and tail structure, and daily aggregation may combine different native interval resolutions. It is not a measure of forecast uncertainty or household expenditure variability.
The analysis is pooled and uncontrolled. Weather, demand, plant availability, fuel prices, transmission constraints, seasonality, and market regime can affect both generation composition and prices. Pearson association does not isolate any of them. There is no causal identification.
The low-carbon measure is an operational proxy, not lifecycle marginal emissions. Imports are not fully allocated, and marginal dispatch is not observed. No actual household load is present, no retail cost is calculated, and no measured household emissions are reported. This is not a household bill study or trading advice.
Practical implication
A household controller should not assume that a day with more low-carbon generation will necessarily have either a smoother or a more volatile price curve. The weak pooled association is not reliable enough to replace direct price data. If a device needs low-price intervals, it should use the actual interval curve and its constraints rather than a daily generation-share shortcut.
Likewise, a controller concerned with environmental impact should state what its signal measures. The low-carbon-share field can provide operational context, but it is not lifecycle marginal emissions. It cannot support claims about the causal emissions consequence of charging or discharging.
For users, the main design implication is to separate objectives and uncertainty. Price variability, expected cost, and the environmental proxy should each have explicit labels. A bill study would additionally need retail charges and a household profile, neither of which is included here.
Reproducibility
Verify the public JSON for VOLT-HOME-WP-074, including slug, measured status, metric name, source tables, cutoff, and all five provenance hashes. From the frozen records, pair finite low-carbon share with daily price standard deviation on matching zone-day identity. Pearson correlation should reproduce -0.10819031240897514 across 44,437 rows.
Any switch from low-carbon share to renewable-only categories, from standard deviation to another volatility statistic, from pooled to zone-specific estimation, or from equal rows to demand weighting is a new specification. It must not be described as a reproduction of this result.
The figure is a public aggregate visualization. Underlying data use remains subject to the registered licensing reference.
Disclosure
Analysis and drafting were model-assisted. This public working paper is not peer reviewed. It is observational, not causal, not a household bill study, and not trading advice. Volt has no live traders or live capital. It does not report measured household emissions. Low-carbon generation share is an operational proxy and is not lifecycle marginal emissions.
References
- International Energy Agency — Electricity 2026
- ACER and CEER — Rewarding flexibility: How retail contract choice can help unlock consumer flexibility
- International Energy Agency — Scaling Up Demand Flexibility
- European Commission — Communication from the Commission on the Citizens Energy Package
- Voltcast — Voltcast data licensing and redistribution