How much battery value comes from the rebound after negative prices?
How much battery value comes from the rebound after negative prices. The association captures the whole monthly curve, not only the first rebound interval.
Abstract
The frozen evidence reports a Pearson correlation of 0.15663334535720164 between BESS-v2 index value and monthly negative-price share over 16,368 observations. The association is positive but small. The evidence interpretation states that the metric captures the whole monthly curve, not only the first rebound interval. It therefore does not measure how much battery value comes from the rebound after a negative-price episode.
Negative prices can enlarge gross arbitrage spreads because charging may have a low or negative wholesale price, while later discharge may occur at a higher price. Yet monthly negative-price share also proxies broader volatility, renewable surplus, seasonality, and market regime. BESS-v2 uses perfect foresight of realized day-ahead prices, is normalized per unit of power, and excludes retail taxes and network charges. The correlation supports an association between months with more negative-price intervals and indexed value, but no fraction of value can be assigned to post-event rebounds without event-level dispatch and a counterfactual that removes or reorders those intervals.
Plain-language answer
Months with a larger share of negative-price intervals tend to have slightly higher BESS-v2 index value in this aggregate: r = 0.1566. That is consistent with negative prices creating wider opportunities, but the relationship is weak and does not isolate the rebound. A month can have many negative intervals and high battery value for other reasons, including high positive spikes elsewhere in the curve.
The published metric looks at the whole month. It does not identify the first interval after a negative episode, whether the battery charged during that episode, or whether it discharged during the rebound. It cannot answer “how much” as a percentage or EUR amount. The proper conclusion is that negative-price prevalence and indexed battery value are positively associated, while rebound-specific value remains unmeasured.
Research question
A rebound study should define an event as one or more contiguous negative-price intervals, identify the first positive intervals after the event, and track a feasible battery state path through charge and discharge. It should distinguish value earned during the negative episode, value earned during the immediate rebound, and value available elsewhere in the day. A counterfactual could replace the event or rebound prices while preserving the rest of the curve.
The current paper-level metric instead correlates monthly BESS-v2 value with monthly negative-price share. That design asks whether the two monthly aggregates co-move. It does not condition on event duration, depth, timing, or rebound height. The title frames a mechanism, while the evidence provides an aggregate diagnostic. This paper reports the diagnostic and specifies what additional evidence would be needed for mechanism attribution.
Data and provenance
The frozen corpus snapshot has SHA-256 7e97489fc8528c8cc8c38830e05b48d949ce1f67b98575dff26f5d7c321e4c67 and was accessed through a SELECT-only, read-only transaction with a 180-second statement timeout. Registered source contracts are day_ahead_prices, bess_index_daily, bess_forecast_daily, generation_mix, and capture_stats. Daily prices cover 2021-01-01 through 2026-08-29; detailed intervals cover 2025-10-01 through 2026-08-29; long-history boundary covers 2015-01-01 through 2026-08-29. Publication cut-off is 2026-08-30T00:00:00Z.
The primary result has sample size 16,368 and unit Pearson r. The analysis-code hash is 57c57de79cdab2b5b6d6c54c485cb5162598c5ba0b0bfe995da40d75e6c52ba9, protocol hash adb36bf6b447af9f96339249b8becaefc20422499cca1977242866347a97bd4b, registry hash 7bcb91d7476d0a69fe9fa75a5c7782f8117e0153f82f9112b7e1d307d3943717, and source-registry hash 07949550ac443ff673fda5c0209b99f137544f3ffecf6775f109bb9d09663bd6. These identities bind the aggregate correlation to a fixed evidence vintage.
Method
BESS-v2 is a normalized per-power day-ahead index calculated with perfect foresight. It can choose favorable intervals from the realized curve and therefore represents an ex post opportunity benchmark. It is wholesale-energy-only and excludes retail taxes and network charges. Monthly negative-price share is the proportion of price intervals below zero within the applicable monthly grouping.
The primary method computes Pearson correlation between monthly BESS index value and monthly negative-price share across the frozen rows. Correlation summarizes linear association and does not identify causality or event contribution. The analysis makes no unadjusted significance claim; within-family Holm control applies to inferential claims. No event window, dispatch attribution, or rebound counterfactual is part of the published result.
Results
The recorded Pearson correlation is 0.15663334535720164, rounded to 0.1566. Its positive sign means rows with greater monthly negative-price share tend to have somewhat greater BESS-v2 value. Its modest magnitude means the relationship is far from deterministic. The result does not state what percentage of index value comes from negative prices or rebounds, and correlation cannot be converted into such a share.
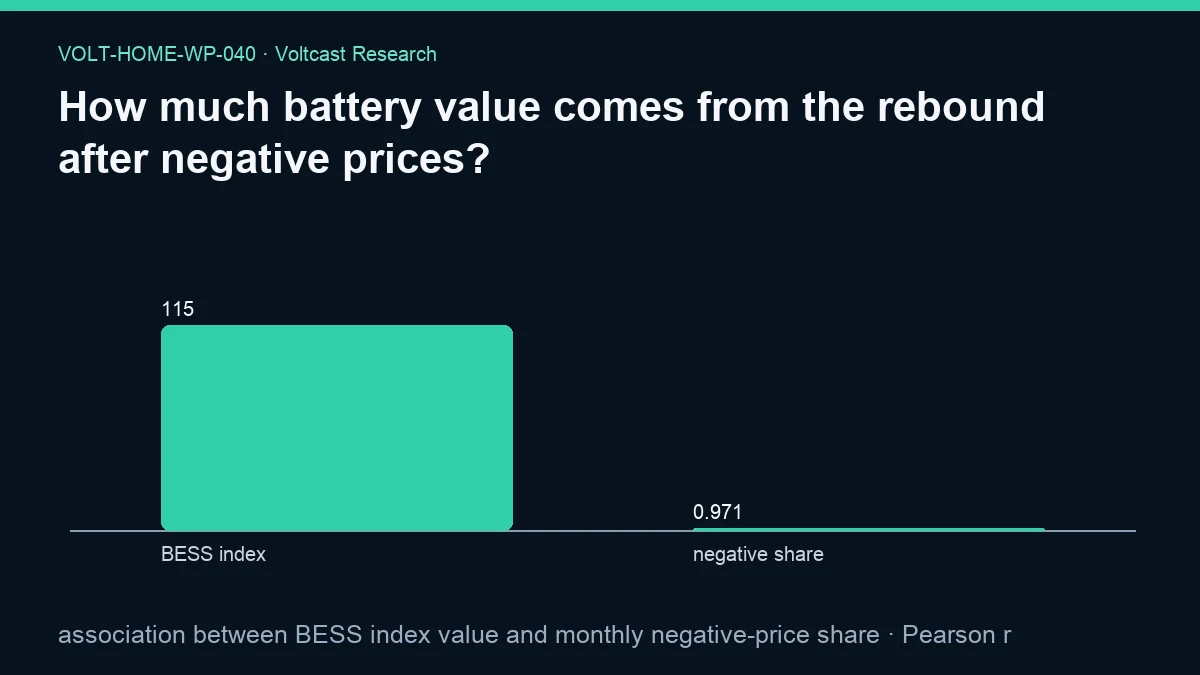
The regenerated JSON reports bootstrap_95_interval: null and no interval method for this estimand. No uncertainty interval is therefore reported for r. The figure publishes BESS index = 115.13824798387097 and negative share = 0.9712125830560879 on their displayed aggregate scales; they are not the correlation coefficient or a rebound-value decomposition.
No secondary result isolates immediate post-negative intervals. The evidence interpretation explicitly says the association captures the whole monthly curve. Accordingly, the result supports aggregate co-movement only. Statements about the depth, duration, first rebound, or amount captured by a battery would be invented.
Robustness and placebo checks
A rebound-specific extension should identify events at native market resolution and compare several windows after each event. It should match on zone, season, duration, negative-price depth, and broader daily volatility. The battery path must charge and discharge feasibly; a high post-event price is irrelevant if the asset was already full, unavailable, or committed elsewhere. Forecast timing must determine whether the event and rebound were knowable.
Placebos should use pre-event windows, randomly shifted event times, and non-negative low-price episodes with similar curve volatility. If rebound value is real as a distinct mechanism, it should exceed those controls under a preregistered event definition. Another check should remove negative intervals from the monthly curve while preserving ranks elsewhere and recompute the index. None of these tests is reported here. The present safeguards are the exact aggregate label and refusal to invent correlation uncertainty.
Limitations
Monthly aggregation hides event sequence. Negative-price share does not encode how negative prices were, how long episodes lasted, when they occurred, or how sharply prices rebounded. Pearson correlation can be driven by confounders such as seasonality, renewable output, demand, outages, market design, and general volatility. It also assumes a linear summary of a relationship that may be nonlinear.
Perfect foresight overstates a controller’s ability to place charge and discharge around an event. Wholesale-only accounting excludes retail taxes, network charges, import-export asymmetry, degradation, and auxiliary use. A retail price can remain positive when the wholesale component is negative. BESS-v2 is normalized and is not a household bill or observed device cashflow. No interval is reported for the correlation. These limitations prevent rebound attribution or a deployable earnings claim.
Event overlap must be handled explicitly. Several negative-price episodes can occur within one day, and a single charge may be followed by several candidate discharge intervals. Counting each rebound independently can reuse the same battery energy and overstate attributed value. A valid event study should allocate capacity once along the chronological state path and define how value is assigned when event windows overlap.
The counterfactual also needs care. Replacing negative prices with zero changes the spread but may not preserve the market conditions that produced the event. A matched non-negative low-price episode or a curve-shape control can offer a more informative comparison, while still remaining descriptive about causality. The monthly correlation performs neither operation. It is therefore evidence of a regime association, not a decomposition of BESS-v2 value into negative-price charging, immediate rebound, and unrelated daily opportunities.
Retail implementation can diverge sharply from the wholesale event. A supplier may add taxes, levies, network charges, margins, or an export price that does not mirror the import price. A negative wholesale interval may therefore remain positive for charging, and a high wholesale rebound may not be fully available on discharge. The frozen correlation deliberately excludes those terms, so it should not be used to market a tariff-specific event strategy.
Forecastability is part of attribution as well. A rebound visible only after the negative episode ends belongs to perfect hindsight unless a preregistered forecast or rule anticipated it. Event studies should separate scheduled day-ahead actions from intraday updates and disclose whether revisions were available before each action. BESS-v2’s perfect-foresight convention can map the opportunity after the fact, but only a clock-valid replay can show attainable rebound capture. The current monthly association cannot bridge that gap.
Practical implication
Negative-price prevalence can be a useful regime indicator, but it should not be treated as a direct estimate of battery value. Analysts should examine full curve shape, event depth and duration, rebound timing, battery state, and all-in tariffs. A controller should schedule from forecasts available before delivery and should not assume every negative interval is import-cheap after retail charges.
Use the r = 0.1566 association to motivate event-level research, not to multiply a battery estimate by negative-hour share. Report perfect-foresight index value and forecast-based capture separately. If rebound attribution is required, publish the event definition, counterfactual, matched controls, and fraction of indexed value actually assigned to the window. Until then, the accurate public statement is simply that monthly negative-price share and normalized index value co-move weakly and positively.
Reproducibility
Retrieve /research-data/home-papers/how-much-battery-value-comes-from-the-rebound-after-negative-prices.json. Verify status measured, sample size 16,368, Pearson r value 0.15663334535720164, figure values, absence of an interval, and the whole-month interpretation. The manifest records evidence SHA-256 04ec91e32a1e92335974563a81ae7edf587a94a5107b7c74cf90956d5fce4bdb and figure SHA-256 5250689d809d6391f93c0ac16ca1f1b27e3a6d47d98116dfb1ebc70f77fd64f2.
A reproduction should use the exact snapshot, code, protocol, registry, windows, and publication cut-off. It must compute the monthly aggregate correlation and must not relabel it as event attribution. A rebound extension requires separately registered event windows and controls. Licensing is governed by /legal/data-licensing and Voltcast data licensing and redistribution.
Disclosure
Analysis and drafting were model-assisted. The whole-month scope, absent event attribution, and incompatible interval are disclosed. This public working paper is not peer reviewed. It is not trading advice, financial advice, an investment recommendation, or operational authorization. Voltcast has no live traders or live capital, and no battery action follows from this correlation.
References
energy-informatics-storage— Energy Informatics. Risk and reward: evaluating household energy storage for optimizing demand-side flexibility under dynamic tariffs. Kind: peer-reviewed.acer-retail-2025— ACER and CEER. Rewarding flexibility: How retail contract choice can help unlock consumer flexibility. Kind: official.iea-electricity-2026— International Energy Agency. Electricity 2026. Kind: official.dynamic-tariff-viability— Advances in Applied Energy. Assessing the conditions for economic viability of dynamic electricity retail tariffs for households. Kind: peer-reviewed.volt-research-content— Voltcast. Voltcast Research Content Plan. Kind: canonical.