How wind-forecast uncertainty changes price and carbon risk
How wind-forecast uncertainty changes price and carbon risk. Observed output share is a proxy for wind regimes, not a wind-forecast error measurement.
Abstract
Wind-forecast uncertainty can matter for household scheduling, but the frozen evidence for this paper does not measure forecast uncertainty. It measures the Pearson association between observed wind generation share and daily price standard deviation. Across 44,437 paired zone-day observations, the reported correlation is -0.0564091053264623. The near-zero negative association indicates little pooled linear relationship between the observed wind-share proxy and this daily price-variability measure.
The result should be treated as a wind-regime diagnostic, not an error or uncertainty study. There is no forecast-minus-realization field in the primary metric, no probabilistic wind interval, and no carbon-risk outcome. The broader family’s low-carbon generation share is an operational proxy, not lifecycle marginal emissions; it does not fully allocate imports or identify marginal response. This paper therefore does not claim that forecast uncertainty causes prices or emissions to change, and it reports no measured household emissions. It documents a mismatch between the registered title and the available estimand so readers do not mistake observed output share for forecast error.
Plain-language answer
The frozen result cannot tell us how wind-forecast uncertainty changes price or carbon risk. It tells us that observed wind share and daily price variability had a very weak negative linear association: Pearson r was -0.0564091053264623 across 44,437 observations.
Observed wind output is not forecast uncertainty. A high wind-share day can have been forecast accurately or poorly; the primary metric does not distinguish those cases. Daily price standard deviation is also not forecast risk, bill risk, or an emissions measure. The number is useful only as a descriptive check on whether broad wind regimes line up with more variable daily prices in the pooled panel.
No carbon-risk estimate follows. Low-carbon generation share is an average operational proxy, not lifecycle marginal emissions, and the study has no marginal generator or household load. The honest answer to the title is that this evidence is insufficient for the uncertainty claim.
Research question
The registered title asks how uncertainty in wind forecasts changes price and carbon risk. The implemented metric asks a different, preliminary question: are observed wind share and within-day price standard deviation linearly associated? The evidence itself states that observed output share is a proxy for wind regimes, not a wind-forecast error measurement.
A forecast-uncertainty study would need at least a forecast vintage, realized wind output, an error or predictive distribution, a decision clock, and an outcome measured after that clock. A carbon-risk study would additionally need a clearly defined environmental accounting measure. The primary result includes none of those elements.
The paper therefore treats the measured association as a diagnostic that may motivate a properly clocked study. It does not use title language to enlarge the evidence. There is no causal identification, no uncertainty treatment, and no measured household-emissions outcome.
Data and provenance
The public evidence JSON in the frontmatter defines the publication record. Its registered contracts are generation_mix, day_ahead_prices, capture_stats, res_accuracy, and zone_temp_weighted. Although res_accuracy is in the family contract, the primary calculation described by the frozen analysis uses observed wind share from generation records and daily price standard deviation from matching price records.
The evidence lists daily prices from 2021-01-01 to 2026-08-29, detailed intervals from 2025-10-01 to 2026-08-29, and long history from 2015-01-01 to 2026-08-29. The publication cutoff is 2026-08-30T00:00:00Z. Extraction was conducted in a read-only transaction under a 180-second statement timeout.
The snapshot SHA-256 is f77e3ae328f93916e53b1bab7516e1d0ac740a0dbf424cd2b73c81fee2559318. The analysis-code hash is 57c57de79cdab2b5b6d6c54c485cb5162598c5ba0b0bfe995da40d75e6c52ba9, the protocol hash is adb36bf6b447af9f96339249b8becaefc20422499cca1977242866347a97bd4b, the paper-registry hash is 7bcb91d7476d0a69fe9fa75a5c7782f8117e0153f82f9112b7e1d307d3943717, and the source-registry hash is 07949550ac443ff673fda5c0209b99f137544f3ffecf6775f109bb9d09663bd6.
No customer telemetry, household bill, device schedule, or measured household emissions enter the result. No numeric findings are imported from the contextual references.
Method
The analysis constructs paired zone-day rows containing daily price information and generation shares. For each retained row, it takes observed wind share and the daily price standard deviation. Pearson correlation is computed across these two vectors.
This method answers whether days with more observed wind share tend to have higher or lower within-day price dispersion on average in the pooled panel. It does not evaluate a wind forecast. There is no subtraction of forecast from actual, no calibration assessment, and no conditioning on a forecast issue time. Calling the input “uncertainty” would therefore be inaccurate.
The price variable is one daily shape summary. Standard deviation does not identify when variability occurs, whether it was anticipated, or whether it matters during a household’s flexible window. The pooled estimator also does not weight by load, population, or generation, and it includes no zone or seasonal controls.
The carbon side of the title is not measured. Low-carbon share in this family is an operational generation proxy, not lifecycle marginal emissions. An observed wind share cannot determine the marginal emissions consequence of adding household demand. The method is descriptive and non-causal.
Results
The primary result is -0.0564091053264623 Pearson r across 44,437 observations. The sign is negative, but the magnitude is very small. In this pooled linear summary, higher observed wind share is associated with slightly lower daily price standard deviation.
The frozen interpretation correctly limits the result: “Observed output share is a proxy for wind regimes, not a wind-forecast error measurement.” The association does not tell us whether forecast errors are larger on high-wind days, whether prices respond to forecast revisions, or whether a household schedule faces more forecast regret.
No carbon-risk value is reported. The evidence cannot show that wind uncertainty raises or lowers emissions, and it cannot quantify measured household emissions. The low-carbon operational proxy is not lifecycle marginal emissions. The result’s contribution is negative in an epistemic sense: it prevents a regime correlation from being misreported as an uncertainty effect.
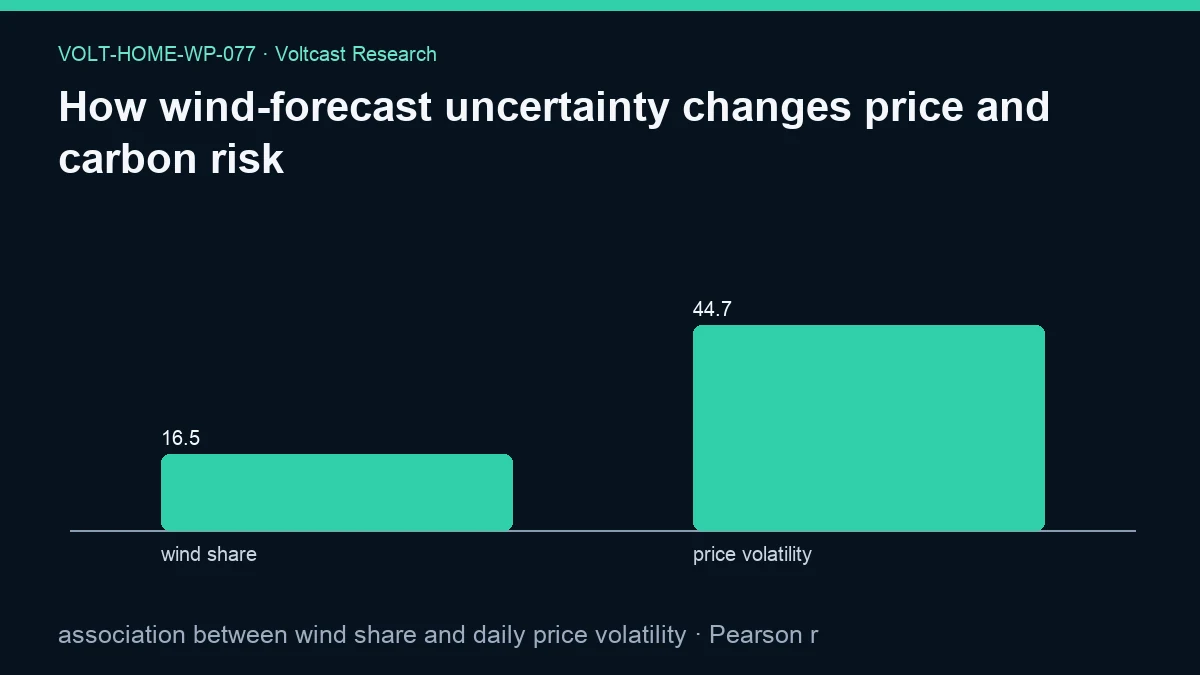
The figure labels are “wind share” and “price volatility,” with values 16.51680292533408 and 44.6633251367104, rendered as 16.5 and 44.7. They summarize inputs on different scales rather than the Pearson coefficient. The evidence reports a null bootstrap interval and says the interval method is “not reported for this estimand.”
Robustness and placebo checks
The evidence says within-family Holm control applies to inferential claims and labels this output descriptive without an unadjusted significance claim. There are no secondary results, assumptions, or paper-specific placebo outcomes in the JSON. We do not claim significance or robustness.
A proper robustness programme for the measured diagnostic could estimate the association within zones and seasons, use alternative price-dispersion measures, weight by demand, and separate market-resolution periods. A placebo could misalign wind-share dates and price dates. A proper uncertainty study would instead use issue-vintage forecast errors and compare high-error with low-error outcomes under a frozen clock.
Those designs are not completed here. The available integrity checks are provenance-based: frozen registry, snapshot, analysis, evidence, and figure. They support exact reproduction of the diagnostic but cannot validate a forecast-uncertainty claim that was never measured.
Limitations
The largest limitation is construct validity. Observed wind share is not forecast uncertainty. A study with that title should not substitute one for the other, so the paper reports the mismatch explicitly.
Daily price standard deviation is not a complete risk measure. It ignores timing, tails, forecastability, household availability, and the cost structure of a retail tariff. It is not household bill volatility.
The pooled association can hide zone and seasonal heterogeneity. Weather, load, fuel prices, constraints, outages, and market regimes can affect both wind share and price shape. With no controls or identification design, causality cannot be inferred.
The environmental boundary is also limited. Low-carbon generation share is an operational proxy, not lifecycle marginal emissions, and imports are not fully allocated. No marginal response to household load is modeled. This is not a household bill study, reports no measured household emissions, and provides no trading advice.
There is also no decision-clock comparison in the primary result. Observed output is known after the operational period represented by the generation record, whereas a useful charging decision must be made from information available beforehand. Without a forecast issue time and preserved vintage, the analysis cannot quantify prospective scheduling risk. Retrospective regime labels must not be presented as information a household controller actually possessed.
Practical implication
A home-energy product should not use observed wind share as a label for forecast uncertainty. If a schedule depends on a wind forecast, the product should expose forecast age, issue vintage, uncertainty range or historical error, and the decision made from that information. That requires a different evidence object.
The weak diagnostic association also means observed wind share alone is not a useful substitute for the actual price curve when scheduling devices. A controller should optimize against the relevant interval data and constraints.
For environmental objectives, the signal must be described accurately. Operational low-carbon share can provide generation context, but it is not lifecycle marginal emissions and cannot support causal household-emissions claims. The present result should be used to define a better study, not to market a carbon or bill benefit.
Reproducibility
Open the evidence file for VOLT-HOME-WP-077 and confirm the slug, status, metric, source contracts, cutoff, and all five provenance hashes. Build the paired zone-day panel, extract observed wind share and daily price standard deviation, and compute Pearson correlation. The frozen output is -0.0564091053264623 with 44,437 observations.
Using forecast error from res_accuracy, adding forecast vintages, measuring revisions, or constructing a carbon-risk outcome would create a different study. Those changes must not be presented as reproductions of this metric.
The public figure depicts the registered association categories. Underlying source-data use remains governed by the exact licensing reference.
Disclosure
Analysis and drafting were model-assisted. This working paper is not peer reviewed. It is not a forecast-error study, not a household bill study, makes no causal claim, and is not trading advice. Volt has no live traders or live capital. It reports no measured household emissions. Low-carbon generation share is an operational proxy, not lifecycle marginal emissions.
References
- International Energy Agency — Electricity 2026
- ACER and CEER — Rewarding flexibility: How retail contract choice can help unlock consumer flexibility
- International Energy Agency — Scaling Up Demand Flexibility
- European Commission — Communication from the Commission on the Citizens Energy Package
- Voltcast — Voltcast data licensing and redistribution