When are tomorrow’s prices actually ready across Europe?
When are tomorrow’s prices actually ready across Europe. This measures Voltcast fan-out after a complete auction curve is detected, not exchange gate closure.
When are tomorrow’s prices actually ready across Europe?
Abstract
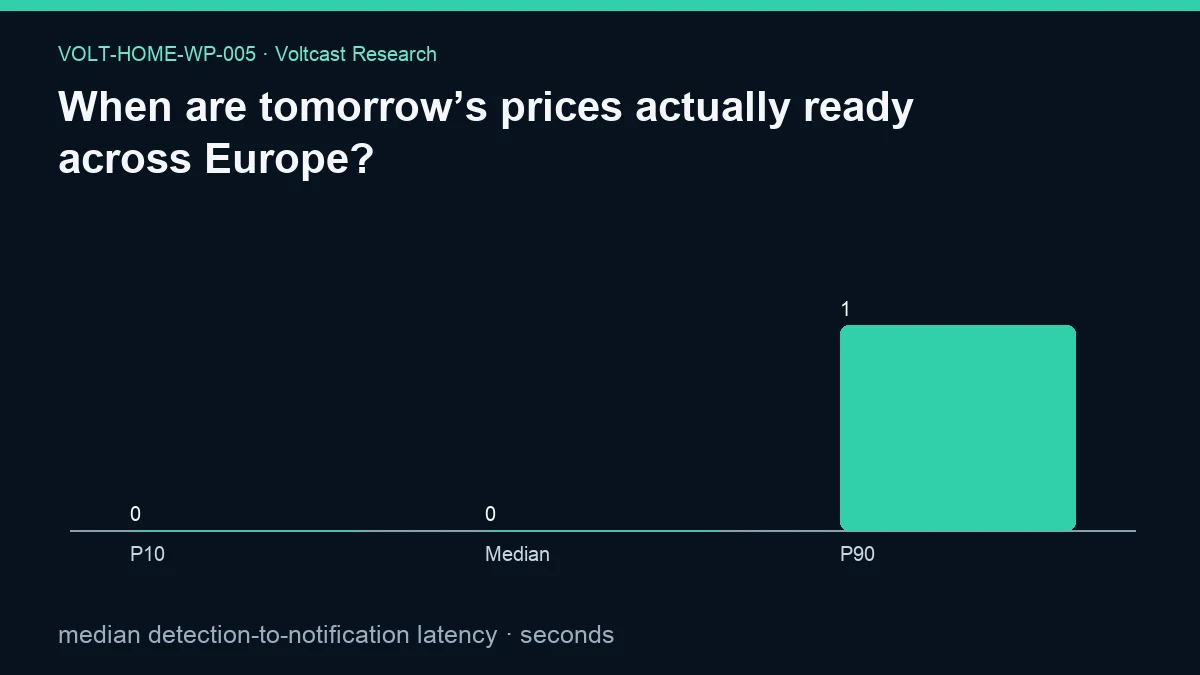
“Published” is not one timestamp. A market gate may close, an upstream source may expose records, a data system may detect a complete curve, and a notification may then fan out to consumers. This working paper measures only the last transition: complete-curve detection to Voltcast notification. The evidence contains 2,141 complete publication receipts and reports a median detection-to-notification latency of 0.0 seconds. It reports no interval for this estimand. The figure's P10, median, and P90 values are 0.0, 0.0, and 1.0 seconds.
The result does not identify exchange gate closure, universal European price readiness, or end-to-end latency from a nominated market time. Publication coverage differs by zone and begins after the webhook rail launched. The measured object is an internal fan-out stage after a complete auction curve has been detected. This is not a household bill study and does not measure realized device response. Analysis and drafting were model-assisted. The paper is not peer reviewed and is not trading advice.
Plain-language answer
Tomorrow's prices are ready for automation only after the full curve needed by that automation has been observed and validated. A scheduled market time is not enough. One zone can appear earlier than another, an upstream payload can arrive in pieces, and a data service must determine that the set is complete before telling a household controller to act.
The evidence measures what happens after that determination. Across 2,141 complete publication receipts, the stored median fan-out latency is 0.0 seconds and the P90 plotted value is 1.0 second. The artifact reports bootstrap_95_interval as null and labels the interval method not reported for this estimand. The honest answer is therefore not a single promise about European publication time. It is that the notification stage was measured as short in the registered receipts, while the evidence does not estimate the earlier upstream wait.
For users, “ready” should be expressed as a receipt state tied to a zone, delivery date, curve completeness rule, and observation timestamp. A fixed daily timer can be a backup, but it should not be mistaken for evidence that the curve exists. Webhook consumers should also be idempotent, because a publication or revision can be observed again.
Research question
The research question is how much time elapses between Voltcast detecting a complete day-ahead auction curve and its notification fan-out for eligible publication receipts. The primary metric is median detection-to-notification latency in seconds.
This does not ask when each European auction closes, when an exchange first publishes, when an upstream API becomes reachable, or when a household device physically changes state. Those are separate clocks. The paper's title is answered by clarifying that “actually ready” is a pipeline state, while the measured statistic covers only one downstream segment.
Data and provenance
The evidence identifies daily prices from 2021-01-01 through 2026-08-29, detailed intervals from 2025-10-01 through 2026-08-29, and a long historical window from 2015-01-01 through 2026-08-29. Those price windows do not define uniform publication-receipt coverage. The explicit limitation says coverage differs by zone and begins after the webhook rail launched.
The source tables are zones, day_ahead_prices, grid_revisions, auction_publications, and ingestion_runs. auction_publications provides the complete-publication receipt object, while the other tables support zone identity, curve completeness, revision lineage, and operational ingestion state. The primary sample size and secondary result both identify 2,141 complete publication receipts or zone-days.
The analysis used a read-only transaction, a 180-second statement timeout, and a publication cutoff of 2026-08-30T00:00:00Z. Snapshot identity is 7e97489fc8528c8cc8c38830e05b48d949ce1f67b98575dff26f5d7c321e4c67. Analysis code is 57c57de79cdab2b5b6d6c54c485cb5162598c5ba0b0bfe995da40d75e6c52ba9; protocol, adb36bf6b447af9f96339249b8becaefc20422499cca1977242866347a97bd4b; paper registry, 7bcb91d7476d0a69fe9fa75a5c7782f8117e0153f82f9112b7e1d307d3943717; source registry, 07949550ac443ff673fda5c0209b99f137544f3ffecf6775f109bb9d09663bd6. The evidence manifest records evidence SHA-256 c5e684cee7ce34668bad11cdb34023a3f0f6d3891a4d85f122f87c1a2d7f6f75 and figure SHA-256 7e21dc1be6f59f1ae15327fa30a60ef2be84f97f6f9303d198eaa93fd6b648e1.
The public evidence contains aggregate timing and provenance, not raw receipt payloads. It therefore supports audit of the declared metric without granting redistribution rights over underlying market data.
Method
The registered method family is paired interval reconstruction, clock-safe counterfactuals, and day-block bootstrap. For this paper, the eligible observation is a complete publication receipt. Completeness must precede the start of the measured fan-out stage; a partial curve is not redefined as ready merely because some points have arrived.
The start timestamp is complete-curve detection within the Voltcast pipeline. The end timestamp is notification fan-out. Their difference is measured in seconds. The primary statistic is the median across eligible receipts. This definition isolates internal notification handling from exchange scheduling and upstream delivery.
That isolation is both useful and limiting. It allows service fan-out to be measured without attributing upstream variation to the notifier. It cannot tell a household at what civil-clock time a particular zone will be ready. For that question, the system would need the complete receipt timestamp by zone and date, along with a clearly defined upstream reference clock.
No uncertainty interval is reported for the median estimand in the regenerated evidence. Within-family Holm control applies to inferential claims. The public result is descriptive and makes no unadjusted significance claim.
Results
The evidence reports 2,141 complete publication receipts. The primary median detection-to-notification latency is 0.0 seconds. The figure labels P10, Median, and P90 carry exact values 0.0, 0.0, and 1.0 seconds. The evidence interpretation explicitly says that this is Voltcast fan-out after a complete auction curve is detected, not exchange gate closure.
The zero point estimate should not be converted into “instantaneous” or “no latency.” Timestamp precision and aggregation may affect serialization, but the public JSON does not provide enough detail to select among those explanations. Because its interval field is null, no confidence range should be attached to the median.
The supported conclusion is operational: eligible complete receipts were followed by a short measured notification stage in this sample. The unsupported conclusions include a universal readiness time for Europe, an upstream service-level guarantee, and an end-to-end device latency.
Robustness and placebo checks
Conditioning on complete publication receipts is the core validity check. Starting the timer at the first partial point would create a different metric and could reward incomplete notification. A curve must satisfy the system's completeness contract before downstream fan-out is measured.
Separating clocks is another control. Exchange gate closure, upstream publication, detection, notification, network delivery, and device execution are distinct events. This paper refuses to substitute one for another. The evidence's own interpretation explicitly excludes exchange gate closure.
The family protocol permits blocked uncertainty calculations where estimator-valid, but this median's current artifact reports none. Within-family Holm control governs any inferential claim. The result remains descriptive.
The zero-valued median is reported beside the exact figure quantiles, without adding a precision conversion, continuity adjustment, or alternative latency statistic. A reproduction should inspect timestamp resolution before drawing conclusions finer than the serialized seconds.
Limitations
Publication coverage differs by zone and begins after the webhook rail launched. A long price history therefore does not imply equally long notification history. The sample should not be projected backward into periods without publication receipts.
The metric begins only after complete-curve detection. It excludes market gate timing, upstream publication delay, polling cadence before detection, network transit to an external consumer, consumer acknowledgment, and physical device action. Calling it end-to-end readiness would be incorrect.
The public artifact does not provide per-zone distributions, outliers, failure counts, or receipt timestamps. It supports the aggregate primary metric but not a zone-specific service guarantee. It reports a 0.0-second median, a 1.0-second P90, and no uncertainty interval, which constrains interpretation to the serialized aggregate.
No tariff, household load, device command, bill, or comfort outcome is measured. This is not a household bill study. Fast notification does not itself create savings.
Practical implication
A home controller should trigger from a completeness-aware publication receipt, not solely from a fixed clock. The receipt should carry zone, delivery date, curve version, detection time, and an idempotency key. The consumer should verify that the expected delivery horizon and intervals are present before replacing a fallback plan.
Timer-based polling still has a role as a recovery path. It should check state rather than assume readiness, back off safely, and avoid duplicate commands if a webhook and poll observe the same publication. Revisions should be versioned so that a later curve can be compared with the one that produced the current schedule.
Public service descriptions should distinguish internal fan-out latency from upstream availability. The evidence supports a claim about the former only. A zone-specific “tomorrow's prices are ready” message should be generated from the complete receipt itself, not extrapolated from this aggregate.
Reproducibility
The machine-readable evidence is /research-data/home-papers/when-are-tomorrows-prices-actually-ready-across-europe.json. It exposes the data windows, source tables, limitation, primary timing value, null interval, complete-receipt count, figure values, disclosure, and hashes.
A reproduction should verify the frozen snapshot, code, protocol, and registry identities. It should preserve the 2026-08-30T00:00:00Z cutoff and SELECT-only transaction. Eligible receipts must be tied to a complete curve and deduplicated by their publication identity. Latency should be calculated from the recorded detection and notification timestamps using a documented precision.
Reviewers should reproduce the exact figure vector [0.0, 0.0, 1.0], median 0.0, sample size 2,141, and null interval. Any future uncertainty estimate belongs in a versioned evidence update with a new hash, not in an undocumented reinterpretation of this working paper.
Disclosure
Analysis and drafting were model-assisted; sources, code, assumptions, and evidence hashes are disclosed. This paper is not peer reviewed, is not a household bill study, and is not trading advice. Volt has zero live traders and zero live trading capital; C0R is the only paper strategy. Production weather forecasting is a non-trading service. Publication notifications do not authorize orders, capital, or live trading.
References
- Spam Policies for Google Web Search — Scaled content abuse — Google Search Central.
- Single Day-ahead Coupling (SDAC) — ENTSO-E.
- EU electricity trading in the day-ahead markets becomes more dynamic — European Commission.
- ACER Decision 13-2024 on SDAC Products — Agency for the Cooperation of Energy Regulators.
- Voltcast Architecture — Voltcast.