When inverter power matters more than battery capacity
When inverter power matters more than battery capacity. The duration comparison is an index-level proxy for the capacity-versus-power constraint.
Abstract
The frozen evidence reports a marginal BESS-v2 index value of 48.82663196480939 EUR/MW-day from extending duration from one hour to two hours, based on 16,368 observations. The evidence labels this a proxy for the capacity-versus-power constraint. It does not directly vary inverter power, hold battery energy fixed, or compare equipment costs. Accordingly, it cannot identify a universal point at which inverter power matters more than battery capacity.
What the result can show is that the second hour has a measurable normalized index increment under a fixed per-power convention. Duration and power constrain dispatch differently: energy capacity determines how long the asset can sustain output, while inverter power determines how quickly it can move that energy. BESS-v2 is evaluated with perfect foresight on wholesale day-ahead prices and omits retail taxes and network charges. The 48.83 EUR/MW-day figure is therefore a market-index sensitivity, not a household bill outcome or measured site cash. A true power-versus-capacity decision must run a two-dimensional asset grid with common energy, power, efficiency, degradation, forecast clock, and cost assumptions.
Plain-language answer
Adding battery capacity and adding inverter power solve different bottlenecks. If the battery often reaches its power limit during short, sharp price spikes, more inverter power may help more than extra hours of energy. If favorable prices last for several hours and the inverter is not saturated, extra energy capacity may help more. The public evidence does not observe those bottlenecks directly.
It reports that moving from a one-hour to a two-hour duration category adds 48.8266 EUR/MW-day of normalized BESS-v2 index value. That comparison changes energy capacity at fixed normalized power, so it primarily measures the value of an additional hour under the index convention. Calling it an inverter-power threshold would be too strong. The practical lesson is to diagnose which constraint binds on interval-level schedules rather than choosing capacity from a single aggregate number.
Research question
The ideal research question is: across realistic day-ahead curves, when does relaxing the power constraint add more attainable net value than relaxing the energy constraint? Answering it requires at least a grid of inverter power and usable energy capacity. For each point, the same controller must optimize state of charge, efficiency, reserve, degradation, and forecast-based interval choices. Marginal value can then be assigned separately to one additional kW of power and one additional kWh of energy.
The frozen paper-level evidence is narrower. It compares one-hour and two-hour duration categories and reports their index-value difference per normalized MW-day. At fixed power, moving from one hour to two hours adds energy capacity; it does not change inverter power. The evidence’s own interpretation calls the duration comparison an index-level proxy for the capacity-versus-power constraint. This paper preserves the word “proxy” and treats the title as a question the present evidence only partially addresses.
Data and provenance
All measurements are tied to snapshot SHA-256 7e97489fc8528c8cc8c38830e05b48d949ce1f67b98575dff26f5d7c321e4c67, acquired through a SELECT-only, read-only transaction with a 180-second timeout. Source contracts are day_ahead_prices, bess_index_daily, bess_forecast_daily, generation_mix, and capture_stats. Daily price coverage is 2021-01-01 to 2026-08-29; detailed intervals, 2025-10-01 to 2026-08-29; long-history boundary, 2015-01-01 to 2026-08-29. The evidence cut-off is 2026-08-30T00:00:00Z.
The primary metric is “marginal index value from one-hour to two-hour duration,” unit EUR/MW-day, sample size 16,368. Analysis code is identified by 57c57de79cdab2b5b6d6c54c485cb5162598c5ba0b0bfe995da40d75e6c52ba9; protocol by adb36bf6b447af9f96339249b8becaefc20422499cca1977242866347a97bd4b; registry by 7bcb91d7476d0a69fe9fa75a5c7782f8117e0153f82f9112b7e1d307d3943717; source registry by 07949550ac443ff673fda5c0209b99f137544f3ffecf6775f109bb9d09663bd6. These hashes and windows define the reproducible evidence boundary.
Method
Volt BESS-v2 is normalized per MW of power. A one-hour duration at that power represents less usable energy than a two-hour duration. The metric subtracts the one-hour indexed value from the two-hour indexed value and reports the marginal difference in EUR/MW-day. Because power normalization is fixed, the difference is informative about added duration, not a direct experimental change in inverter rating.
The index selects opportunities from the realized day-ahead curve with perfect foresight. It thus describes a ceiling-like market opportunity under its constraints. An actual controller must choose from forecasts available before delivery and may fail to identify the best short spike. Accounting is limited to wholesale energy and excludes retail taxes and network charges. The result is descriptive and makes no unadjusted significance claim; within-family Holm control applies if inferential tests are introduced.
Results
The primary result is 48.82663196480939 EUR/MW-day, or 48.83 EUR/MW-day when rounded to two decimals. It is the frozen aggregate difference from one-hour to two-hour duration under BESS-v2. This is positive indexed marginal value, but the JSON does not compare that value with the cost of an additional MWh of capacity. It also does not report the marginal value of added inverter power, so no crossover between the two investments can be calculated.
The regenerated evidence reports bootstrap_95_interval: null and no interval method for this estimand. This paper therefore makes no uncertainty claim around the point estimate. It reports the point estimate, sample size, unit, and proxy interpretation exactly as frozen.
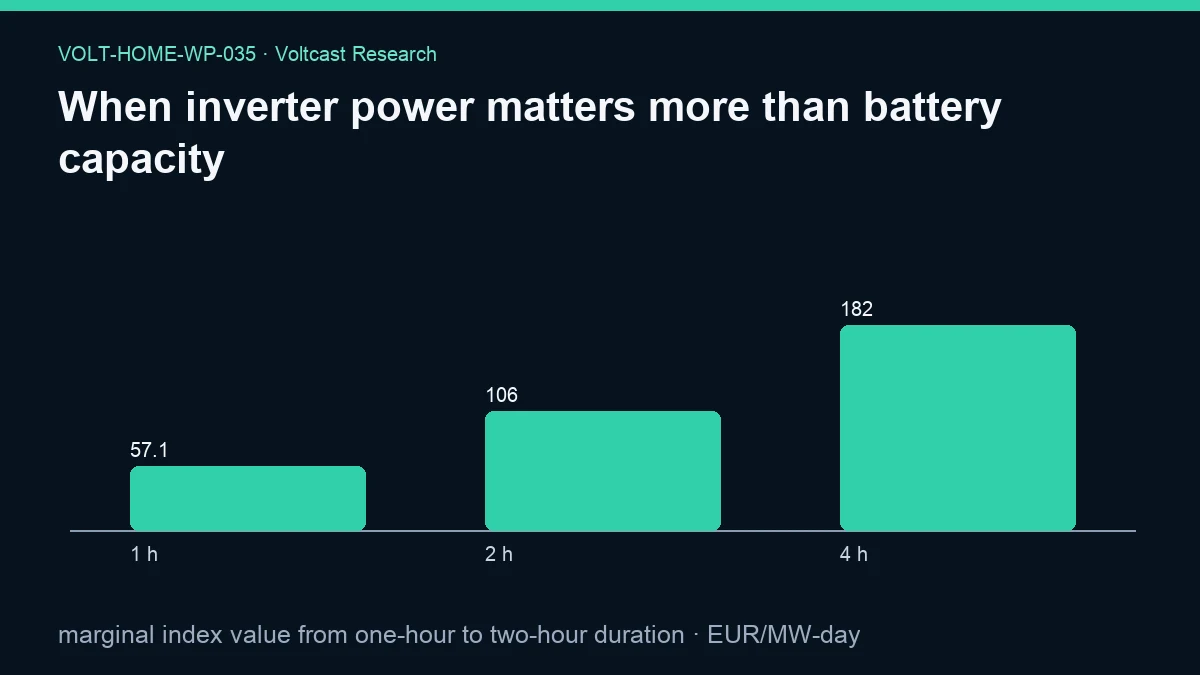
The figure publishes 1 h = 57.09284329178886, 2 h = 105.91947525659825, and 4 h = 182.4024254032258 on the indexed-value scale. The one-to-two-hour difference is the 48.82663196480939 EUR/MW-day primary metric. A two-to-four-hour increment is not a separate primary result. Nor are binding-power frequencies, clipped energy, or price-spike durations. Those missing diagnostics are precisely what would be needed to answer when inverter power dominates.
Robustness and placebo checks
A robust power-versus-capacity study would hold usable energy constant while varying inverter power, then hold power constant while varying energy. It would calculate finite-difference marginal values on the same zone-days and compare them with matched equipment costs. It should also stress efficiency, degradation, reserve state of charge, and native interval resolution. The present evidence runs no published two-dimensional grid, so it cannot claim those checks passed.
A useful placebo would cap power so loosely that it never binds; increasing it further should add no value. Another would use a flat daily price curve; neither more power nor more duration should create arbitrage value. A third would replace perfect foresight with a pre-decision forecast, because short price spikes may be especially difficult to schedule. These are prospective validation criteria. The current robustness rests on frozen provenance and explicit limitation of the result to a duration proxy. No unreported uncertainty bounds are promoted into a statistical claim.
Limitations
The core limitation is identification. A duration change at fixed power changes energy capacity, not inverter power. It cannot determine when power matters more. The evidence lacks equipment costs, so even a correctly measured marginal market value cannot rank investments. It also lacks state-of-charge traces, clipping counts, power-saturation frequency, and event-duration distributions.
Perfect foresight overstates attainable interval selection. Wholesale-only accounting omits taxes, grid fees, retail import-export asymmetry, and fixed charges. Real inverters have efficiency curves, thermal limits, standby consumption, and sometimes asymmetric charge and discharge power. Batteries reserve energy for backup or warranty protection. The normalized index is not an observed household outcome, and no uncertainty interval is reported for the primary metric. Together these limits make the 48.83 figure a benchmark increment, not a design rule.
Asset-cost symmetry is another missing comparison. One additional hour of duration at one normalized MW implies additional usable energy, while one additional MW of inverter power can require changes to cells, cabling, interconnection, and thermal design. Comparing their index increments without their incremental costs answers an engineering opportunity question but not an investment question. A future analysis should express both marginal values against a common cost and lifetime denominator and disclose whether grid import or export limits bind before the inverter does.
Decision cadence can alter which constraint appears valuable. A short price excursion may reward power only if the controller sees it at native resolution and can respond within the permitted schedule. Hourly aggregation can smooth the excursion and mechanically make duration look more important. The present evidence does not publish such a cadence comparison. Preserving native intervals and recording clipping or saturation events would make the power-versus-energy diagnosis auditable.
Practical implication
Use interval-level diagnostics before deciding whether to add power or capacity. Count how often the forecast-based schedule reaches the inverter limit, how much high-value energy is clipped, how often state of charge reaches its bounds, and how long favorable price blocks persist. Then estimate the marginal net value of an additional kW and an additional kWh under the same cost and forecast assumptions.
The BESS-v2 one-to-two-hour increment can anchor the capacity side of that comparison. It should be paired with a separately measured power increment and realistic capital and wear costs. A controller should never infer that higher power is valuable merely because the price curve is volatile; the event must be forecastable, long enough to act on, and compatible with state of charge. Reporting the perfect-foresight benchmark alongside the deployable schedule makes the lost opportunity visible without overstating it.
Reproducibility
The evidence JSON is /research-data/home-papers/when-inverter-power-matters-more-than-battery-capacity.json. Verify status measured, value 48.82663196480939 EUR/MW-day, sample size 16,368, assumptions, figure values, absence of an interval, and proxy interpretation. The evidence manifest records SHA-256 df4c5a8a92753036722b4b57afc3f4b166ba99b5fc4d07cc63008956a9a9bdb2; the figure hash is 102be9dd27a287b53df2309d005b2b06c8f7540b8600b5620c19c2faf23dff1f.
A reproduction must match snapshot, protocol, registry, code hash, windows, and publication cut-off. It should subtract matched one-hour and two-hour BESS-v2 values at common power normalization. Any attempt to infer inverter-power value must be registered as an extension with a separate asset grid. Licensing is governed by /legal/data-licensing and Voltcast data licensing and redistribution.
Disclosure
Analysis and drafting were model-assisted. Frozen data identities, assumptions, and the gap between the title and identified metric are disclosed. This public working paper is not peer reviewed. It is not trading advice, financial advice, an investment recommendation, or engineering certification. Voltcast has no live traders or live capital, and the result does not authorize a purchase or operating action.
References
energy-informatics-storage— Energy Informatics. Risk and reward: evaluating household energy storage for optimizing demand-side flexibility under dynamic tariffs. Kind: peer-reviewed.acer-retail-2025— ACER and CEER. Rewarding flexibility: How retail contract choice can help unlock consumer flexibility. Kind: official.iea-electricity-2026— International Energy Agency. Electricity 2026. Kind: official.dynamic-tariff-viability— Advances in Applied Energy. Assessing the conditions for economic viability of dynamic electricity retail tariffs for households. Kind: peer-reviewed.volt-research-content— Voltcast. Voltcast Research Content Plan. Kind: canonical.