Why one-, two-, and four-hour batteries earn differently
Why one-, two-, and four-hour batteries earn differently. Longer duration accesses more spread but does not scale linearly because cheap and expensive intervals are finite.
Abstract
The frozen BESS-v2 evidence reports a four-hour-to-one-hour index ratio of 3.194838702830186 across 16,368 observations. A four-hour asset therefore has more indexed day-ahead spread access than a one-hour asset under the common normalization, but the recorded ratio is below four. The evidence interpretation attributes that nonlinearity to finite cheap and expensive intervals: extending duration accesses more spread, yet cannot replicate the best one-hour pair four times at the same margin.
This result is a normalized comparison, not an estimate for a named battery. BESS-v2 uses the realized day-ahead curve with perfect foresight, counts wholesale energy only, and omits retail taxes and network charges. The ratio can summarize how duration changes the opportunity surface while holding the index convention fixed. It cannot establish device payback, attainable schedule value, or the relative merit of adding energy capacity versus inverter power at a particular site. Those decisions require cost, efficiency, degradation, usable-capacity, and forecast-clock assumptions not contained in the evidence.
Plain-language answer
A longer battery can shift more energy, but each extra hour usually reaches a less extreme part of the price curve. The best one-hour schedule can focus on the cheapest charge interval and the most expensive discharge interval. A two-hour or four-hour schedule needs additional intervals. Those additional intervals are often not as cheap or not as expensive, so value rises more slowly than duration.
The recorded four-hour-to-one-hour ratio is about 3.19, not 4.00. That means four hours of indexed duration delivered roughly 3.19 times the one-hour indexed value under this specific frozen convention. It does not mean a four-hour household battery returns 3.19 times as much money. The index is normalized per unit of power, omits many costs, and chooses intervals with perfect hindsight. A real controller may capture less, and a longer battery generally costs more. The useful insight is diminishing marginal spread access, not a universal technology ranking.
Research question
The question is why one-, two-, and four-hour batteries show different indexed value even when they face the same day-ahead curve. Duration is the usable-energy-to-power ratio: at fixed power, a longer-duration asset can charge or discharge for more hours. That expands the set of feasible shifts. Yet the market curve contains a finite number of low and high intervals, and their ordering and spacing constrain which combinations can be used.
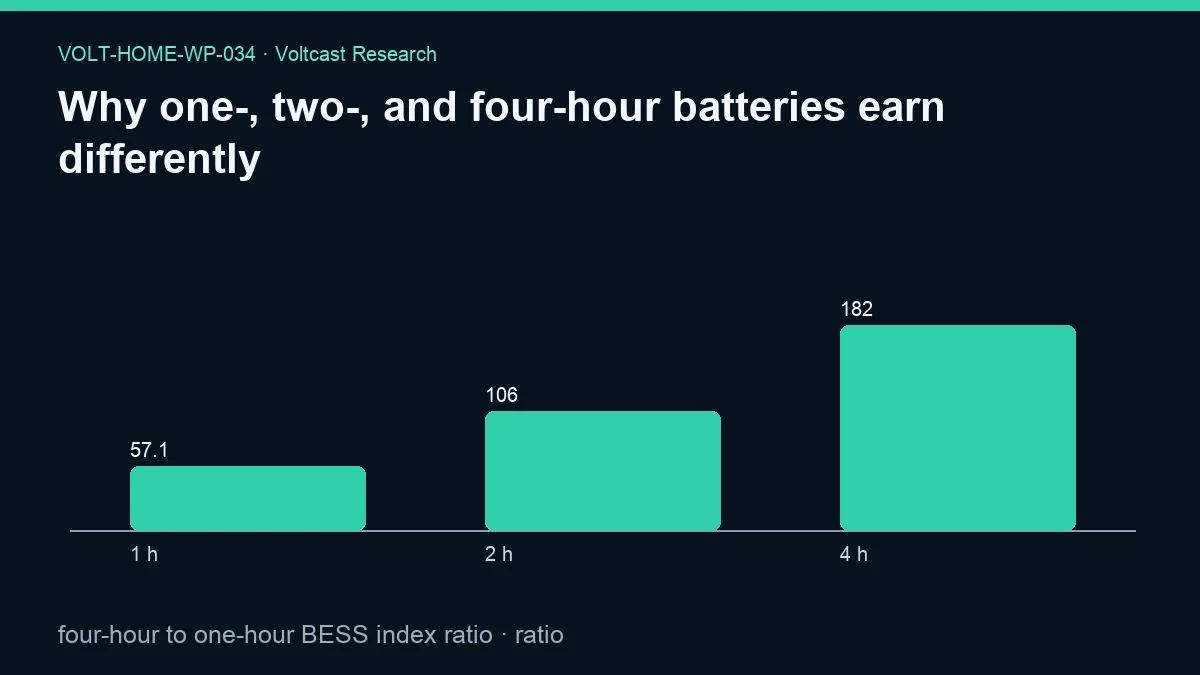
The registered primary metric compares four-hour and one-hour BESS-v2 index values. The figure additionally publishes the absolute aggregate values for 1 h, 2 h, and 4 h. The empirical headline remains the recorded four-to-one ratio and the frozen interpretation that value does not scale linearly.
Data and provenance
The analysis is bound to the common SELECT-only snapshot with SHA-256 7e97489fc8528c8cc8c38830e05b48d949ce1f67b98575dff26f5d7c321e4c67. The transaction is marked read-only with a 180-second statement timeout. Registered contracts are day_ahead_prices, bess_index_daily, bess_forecast_daily, generation_mix, and capture_stats. Daily prices cover 2021-01-01 through 2026-08-29, detailed intervals cover 2025-10-01 through 2026-08-29, and the long-history boundary covers 2015-01-01 through 2026-08-29. Publication is cut at 2026-08-30T00:00:00Z.
The metric is the four-hour-to-one-hour BESS index ratio, unit ratio, with sample size 16,368. Provenance hashes are analysis code 57c57de79cdab2b5b6d6c54c485cb5162598c5ba0b0bfe995da40d75e6c52ba9, protocol adb36bf6b447af9f96339249b8becaefc20422499cca1977242866347a97bd4b, registry 7bcb91d7476d0a69fe9fa75a5c7782f8117e0153f82f9112b7e1d307d3943717, and source registry 07949550ac443ff673fda5c0209b99f137544f3ffecf6775f109bb9d09663bd6. These identifiers are necessary because rebuilding from a later mutable corpus could change the comparison.
Method
BESS-v2 normalizes each duration per unit of power. At one megawatt of normalized power, one-, two-, and four-hour categories imply different energy capacities, so the ratio reflects duration expansion while power scale remains common. It does not hold capital cost or battery size constant. A four-hour system contains more usable energy than a one-hour system at the same power, and the evidence does not price that extra energy capacity.
The perfect-foresight optimizer evaluates the realized day-ahead curve. For each duration, it can identify favorable intervals ex post under the index rules. Longer duration must extend into additional intervals, which generally have less extreme prices than the single best pair. The primary ratio divides the four-hour indexed value by the one-hour indexed value across the frozen sample. Accounting is wholesale-only, with no retail taxes or network charges. The result is descriptive; within-family Holm control applies to inferential claims, and none is made here.
Results
The primary ratio is 3.194838702830186. Rounded to two decimals, the four-hour index is 3.19 times the one-hour index under BESS-v2. Because four hours is four times one hour at fixed power, the ratio below four demonstrates sublinear indexed scaling in the recorded aggregate. The evidence’s stated interpretation is that longer duration accesses more spread but does not scale linearly because cheap and expensive intervals are finite.
The figure publishes 1 h = 57.09284329178886, 2 h = 105.91947525659825, and 4 h = 182.4024254032258 in the figure’s indexed-value scale. These values show the rising but sublinear path that produces the 3.194838702830186 primary ratio. The regenerated JSON reports no interval for this estimand, so no confidence interval is attached to the ratio.
The evidence supports the published aggregate indexed values and their relative ratio. It does not identify which zones, seasons, or curve shapes drive that ratio. Any claim that a specific market or month causes the diminishing return would exceed the record.
Robustness and placebo checks
A complete duration robustness design would compare all three categories on identical zone-days, verify equal power normalization, and vary efficiency, cycles, and degradation without changing the row set. It would also check whether the four-to-one ratio is stable by zone, season, price regime, and native market resolution. The public JSON does not publish those strata, so no stability claim is made.
A useful placebo would flatten each daily curve while preserving its mean. With no within-day spread, all duration categories should lose arbitrage value, confirming that the ratio comes from curve shape rather than level alone. Another would randomize interval order while preserving prices; if chronology and state constraints are active, feasible value may change. A forecast-clock arm would show how often perfect foresight exaggerates the extra value of duration. These checks are proposed validation logic, not reported outcomes. The strongest current robustness feature is the common frozen sample and explicit refusal to invent ratio uncertainty.
Limitations
The ratio conflates duration with energy capacity at fixed power. It does not compare equal-capital systems, equal-energy systems with different inverters, or actual products. Costs often rise with duration, and those costs are absent. Efficiency, degradation, minimum state of charge, backup reserve, standby consumption, and power tapering can change the relative result. Retail tariff structures can also dilute or reverse wholesale spreads.
Perfect foresight selects the best realized intervals and therefore overstates attainability. The evidence reports aggregate figure values but not zone-level dispersion or an uncertainty interval on the ratio. Finally, the normalized index is not a household bill or measured site outcome. These constraints mean 3.19 is a benchmark ratio under BESS-v2, not an expected multiplier for a purchase.
The comparison also depends on what is kept constant. At fixed normalized power, extending from one to four hours increases usable energy by design. At fixed total energy, the same labels would imply different power ratings and potentially different access to short spikes. At fixed capital cost, both energy and power might change together. These are separate comparisons, and the frozen ratio answers only the first. Keeping that denominator visible prevents a duration result from being mistaken for a technology-efficiency result.
Calendar structure can matter as well. A four-hour schedule needs a broad low-price block and a broad high-price block, while a one-hour schedule can exploit narrow extremes. Native 15-minute markets may therefore present duration value differently from hourly markets even when daily means match. The evidence aggregates the registered rows and does not provide a resolution-stratified ratio, so this mechanism remains an explanation to test rather than a reported subgroup finding.
Practical implication
Duration should be evaluated on marginal value, not by multiplying one-hour value by the number of hours. The evidence shows why such linear extrapolation would be misleading under the frozen aggregate. Analysts should calculate the incremental indexed value from one to two hours and from two to four hours, then compare each increment with the incremental cost of usable energy capacity and additional degradation exposure.
A controller should preserve native interval prices and solve the full state path. It should not assume that all hours in a long schedule capture the day’s maximum spread. A procurement model should then replace perfect foresight with forecast-clock-valid dispatch and include site tariffs and reserve requirements. Reporting both the normalized BESS-v2 ceiling and the realistic schedule makes the duration trade-off auditable without turning a market index into a product promise.
Reproducibility
The frozen JSON is /research-data/home-papers/why-one-two-and-four-hour-batteries-earn-differently.json. Verify measured status, sample size 16,368, value 3.194838702830186, ratio unit, assumptions, figure values, and interpretation. The evidence manifest binds the JSON to SHA-256 4c72f3210798cad3bc1e1695c379f54dcb34aaae8ce6d9210d370eab375a3f2a and the figure to aa98da4f5ff546aaa57f03122c7a9c33f1abbab2204bd887d44eb96e322d3de5.
Reproduction must use the exact snapshot, code, protocol, registry, time windows, and cut-off. It should normalize power consistently before forming the four-hour-to-one-hour ratio and should fail if duration rows are unmatched. Any extension reporting additional strata must identify its evidence rather than attributing it to this JSON. Licensing is described at /legal/data-licensing and Voltcast data licensing and redistribution.
Disclosure
Analysis and drafting were model-assisted. The evidence identities, assumptions, scale inconsistency, and interpretive limits are disclosed. This working paper is not peer reviewed. It is not trading advice, financial advice, an investment recommendation, or a claim about a particular battery. Voltcast has no live traders or live capital, and the normalized comparison does not authorize operational or capital action.
References
energy-informatics-storage— Energy Informatics. Risk and reward: evaluating household energy storage for optimizing demand-side flexibility under dynamic tariffs. Kind: peer-reviewed.acer-retail-2025— ACER and CEER. Rewarding flexibility: How retail contract choice can help unlock consumer flexibility. Kind: official.iea-electricity-2026— International Energy Agency. Electricity 2026. Kind: official.dynamic-tariff-viability— Advances in Applied Energy. Assessing the conditions for economic viability of dynamic electricity retail tariffs for households. Kind: peer-reviewed.volt-research-content— Voltcast. Voltcast Research Content Plan. Kind: canonical.