Are longer negative-price events also deeper?
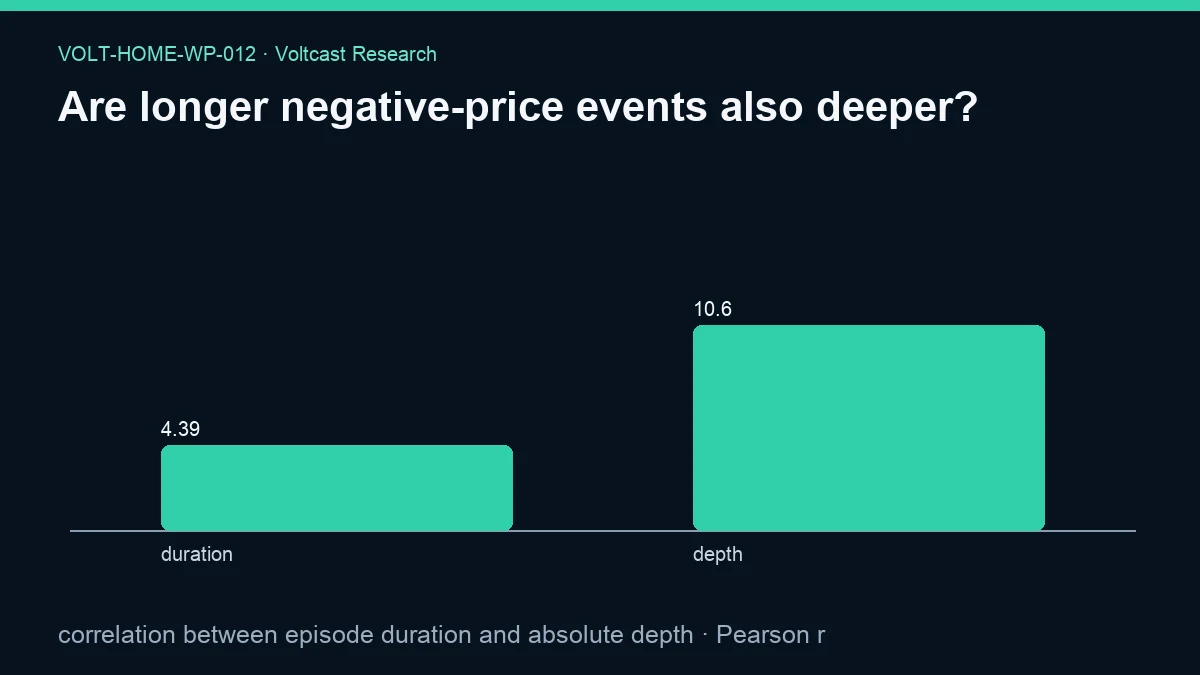
Are longer negative-price events also deeper. A positive value means longer observed episodes tended to reach more negative prices; correlation is not causation.
Are longer negative-price events also deeper?
Abstract
Negative day-ahead electricity prices have at least two distinct dimensions: how long the price remains below zero and how far below zero it reaches. This working paper measures whether those dimensions move together at the episode level. Across 1,191 contiguous negative-price episodes, the evidence reports a Pearson correlation of 0.3206795989675048 between episode duration and absolute depth. The positive sign means that longer observed episodes tended, in this sample, to include more negative prices. It does not establish that duration causes depth, that depth causes duration, or that either dimension produces household savings.
The detailed episode analysis covers ten representative zones from 2025-10-01 through 2026-08-29. Native interval lengths preserve mixed market time units and daylight-saving transitions. The evidence classifies the result as descriptive and makes no unadjusted significance claim. The corrected evidence intentionally reports no bootstrap interval for the correlation estimand. The measured conclusion is consequently limited to the recorded correlation, sample size, direction, machine-readable figure values, and stated provenance.
Plain-language answer
Longer negative-price episodes were generally associated with greater absolute depth, but the relationship was far from a deterministic rule. The measured Pearson value is 0.3206795989675048 across 1,191 episodes. A positive value says the two variables tended to rise together: as duration increased, the magnitude below zero tended to increase as well. It does not say that every long event was deep or every short event was shallow.
This is useful descriptive context for flexibility, yet it is not a bill calculation. A deeper wholesale price can still be unavailable to a household because of retail pricing terms, taxes, network charges, device constraints, or timing. Likewise, a long episode is not fully usable if an electric vehicle is absent or a thermal store is already full. The result describes joint market shape, not household profit, not a future forecast, and not a trading signal.
Research question
The research question is: among observed contiguous episodes whose native day-ahead intervals are priced below zero, is episode duration associated with the episode’s absolute negative-price depth? The registered metric is the Pearson correlation between duration and absolute depth. “Absolute” makes greater negative magnitude a larger positive depth quantity, allowing the sign of the correlation to be read directly.
The scope is intentionally narrower than asking what creates negative prices. Generation composition, demand, network constraints, bidding behavior, and market rules may all coexist with an event, but the evidence does not identify a causal mechanism. Nor does this paper ask how often episodes occur, how they propagate between zones, or what happens immediately after they end. Those require different estimands. Here the target is one episode-level co-movement statistic measured on the frozen snapshot.
Data and provenance
The evidence declares daily price coverage from 2021-01-01 to 2026-08-29, detailed interval coverage from 2025-10-01 to 2026-08-29, and long-history coverage from 2015-01-01 to 2026-08-29. The explicit limitation says detailed episode metrics use ten representative zones after 2025-10-01. Therefore, the episode correlation should not be represented as an all-zone estimate over the full long-history field.
The shared family contract lists day_ahead_prices, generation_mix, border_flows, risk_accuracy, and zone_holidays. Duration and depth arise from day-ahead price intervals. The remaining tables describe the registered research family and potential companion analyses; their presence is not evidence that any one of them explains the correlation. The evidence contains no registered assumptions and no household simulation.
The current public-evidence JSON SHA-256 is 77894b87486a29169c320a3068902729bf3ea1866b5b5b2ff2cc239a915eb96c. The analysis ran in a read-only transaction with a recorded statement timeout of 180 seconds. It was frozen at the publication cutoff 2026-08-30T00:00:00Z. Its analysis-code SHA-256 is 57c57de79cdab2b5b6d6c54c485cb5162598c5ba0b0bfe995da40d75e6c52ba9; protocol SHA-256 is adb36bf6b447af9f96339249b8becaefc20422499cca1977242866347a97bd4b; registry SHA-256 is 7bcb91d7476d0a69fe9fa75a5c7782f8117e0153f82f9112b7e1d307d3943717; snapshot SHA-256 is 7e97489fc8528c8cc8c38830e05b48d949ce1f67b98575dff26f5d7c321e4c67; and source-registry SHA-256 is 07949550ac443ff673fda5c0209b99f137544f3ffecf6775f109bb9d09663bd6. These hashes provide current evidence identity and lineage rather than an independent quality judgment.
Method
The method first defines negative-price episodes as contiguous native delivery intervals with day-ahead prices below zero. Episode duration is accumulated from actual interval lengths, not raw row counts. Episode depth is converted to an absolute magnitude so that a price farther below zero represents more depth. Each episode then contributes one duration-depth pair to the Pearson-correlation calculation.
Pearson correlation measures linear co-movement after centering and scaling the two variables. It has no physical unit. A positive result means larger duration values tend to appear with larger depth values; a zero result would mean no linear association in the sample; a negative result would mean longer episodes tend to be less deep. Correlation alone does not identify direction, mechanism, thresholds, or nonlinear structure. It can also be affected by extreme episodes, clustered zones, and changing market regimes.
The evidence places this paper in a method family containing episode survival, matched calendar controls, reliability scoring, and network lead-lag analysis. It also states that within-family Holm control applies to inferential claims. The published result is explicitly descriptive and makes no unadjusted significance claim. Accordingly, this paper does not translate the correlation into a p-value or causal effect, and it does not claim a statistically adjusted discovery without a corresponding evidence field.
Results
The primary measured result is Pearson r = 0.3206795989675048 with 1,191 episodes. The supplied interpretation is precise: a positive value means longer observed episodes tended to reach more negative prices, and correlation is not causation. This supports the qualitative answer that duration and depth co-moved positively within the analyzed episode set.
The result does not quantify how much deeper an event becomes per additional hour. A correlation is standardized and therefore cannot be read as EUR/MWh per hour. It also does not publish a fitted slope, intercept, explained-variation claim, zone-specific estimate, or event-level dataset. Those quantities must not be inferred from the correlation alone.
The corrected evidence stores bootstrap_95_interval as null and names the interval method “not reported for this estimand.” No confidence interval is therefore claimed for the Pearson correlation. The figure separately exposes labels duration and depth with machine-readable values 4.393576826196473 and 10.569764903442486. Those plotted values are descriptive inputs or summaries under their labels, not uncertainty limits for r.
Robustness and placebo checks
Native-interval episode construction is the first robustness safeguard. It prevents a move from hourly to quarter-hourly rows from mechanically multiplying apparent duration observations. Preserving chronological continuity also avoids joining intervals merely because both are negative when a gap separates them. These checks address episode identity before any correlation is computed.
A fuller robustness analysis would examine zone-clustered uncertainty, leave-one-zone-out sensitivity, rank correlation, winsorization, seasonal partitions, and duration bins. It would also compare against calendar-matched episodes or shuffled duration-depth pairings. None of those numerical outputs appears in this evidence JSON, so this paper does not claim they passed. They are reproduction recommendations, not hidden results.
The family’s Holm rule protects inferential claims from being selected out of several related tests, but this paper remains descriptive. The intentional null interval avoids attaching unsupported formal uncertainty to the correlation estimand. The conservative robustness posture is to retain the point statistic and distinguish it clearly from the figure’s separately labelled duration and depth values.
Limitations
Detailed episodes come from ten representative zones after 2025-10-01. The evidence does not provide zone names, weights, or a sampling argument that would make the set representative of all European day-ahead markets. Episodes within one zone or season may be correlated with one another, and a pooled Pearson statistic can hide substantial heterogeneity.
Absolute depth is an episode summary, but the evidence does not specify in this public field whether it is the minimum price, a mean magnitude, or another within-episode reduction. Reproduction must recover that definition from the hashed analysis code and protocol rather than assume it. This paper uses the registered metric name and does not add an unsupported operational definition.
The relationship is observational. Common conditions can influence duration and depth simultaneously, and no causal assignment is attempted. The study also omits household tariffs, device availability, network charges, efficiency, degradation, comfort, and counterfactual consumption. It is not a household bill study. Finally, the work was model-assisted and is not peer reviewed. Formal interval inference is intentionally not reported for this estimand.
Practical implication
For home-energy automation, duration and depth should be treated as separate inputs rather than collapsed into a single “negative price” flag. A controller may value a long shallow window differently from a brief deep window because device power, energy capacity, start-up constraints, and retail price pass-through differ. The positive sample correlation suggests these dimensions often moved together, but it is not reliable enough to replace explicit interval-level scheduling.
The practical response is to read the complete native-resolution curve and the household’s actual tariff, then solve the device problem under its own constraints. An alert should state both timing and prices, preserve timezone semantics, and fail safely if the curve is stale. Nothing in this correlation supports buying a device, selecting a tariff, or making a market trade. It is descriptive input to product design, not an action rule.
Reproducibility
A reproducer should obtain the frozen snapshot identified by SHA-256, enforce the 2026-08-30T00:00:00Z cutoff, and work only within the declared detailed-interval scope for the primary result. Price intervals should be ordered on an unambiguous delivery timeline, validated for duplicates and gaps, grouped into contiguous below-zero episodes, and reduced to duration and the protocol-defined absolute depth. The final check is a Pearson correlation across exactly 1,191 episode pairs that reproduces 0.3206795989675048.
The reproduction record should make timezone handling, native interval lengths, missing-data treatment, revision selection, and depth definition explicit. It should preserve the intentional null interval for the correlation and reproduce the figure labels and values exactly: duration 4.393576826196473 and depth 10.569764903442486. Reporting a rerun hash and row-level audit counts would strengthen the public chain without exposing licensed raw data.
Method governance is provided by Voltcast’s Voltcast Research Content Plan. The assigned contextual sources are Electricity 2026 from the International Energy Agency, Rewarding flexibility: How retail contract choice can help unlock consumer flexibility from ACER and CEER, EU electricity trading in the day-ahead markets becomes more dynamic from the European Commission, and Single Day-ahead Coupling (SDAC) from ENTSO-E. They are cited as registered context, not as sources of unreported numerical findings.
Disclosure
Analysis and drafting were model-assisted; sources, code, assumptions, and evidence hashes are disclosed. This is a public working paper, has not been peer reviewed, and does not establish causation. It is not a household bill study and does not estimate realizable savings. It is not trading advice and makes no recommendation to transact, invest, purchase hardware, or select a tariff. No authors, credentials, dates, digital object identifiers, or empirical findings have been invented.
References
- International Energy Agency — Electricity 2026
- ACER and CEER — Rewarding flexibility: How retail contract choice can help unlock consumer flexibility
- European Commission — EU electricity trading in the day-ahead markets becomes more dynamic
- ENTSO-E — Single Day-ahead Coupling (SDAC)
- Voltcast — Voltcast Research Content Plan