Are negative prices solar events, wind events, or both?
Are negative prices solar events, wind events, or both. This descriptive comparison distinguishes solar and wind co-movement without assigning causality.
Are negative prices solar events, wind events, or both?
Abstract
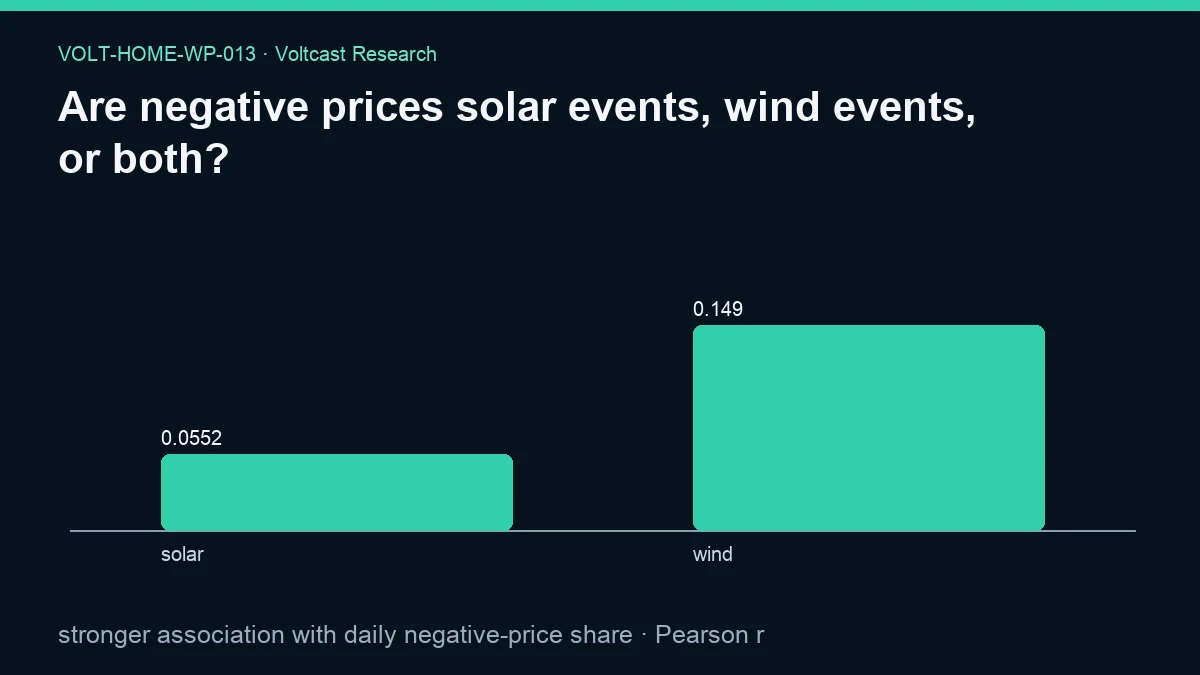
This working paper compares the daily co-movement of solar and wind generation with the share of day-ahead intervals priced below zero. In the regenerated evidence, the solar association is Pearson r = 0.055234686794402105 and the wind association is Pearson r = 0.1490150194605299. The primary result records wind as the stronger association, with a sample size of 44,437. The comparison is descriptive: it shows that daily negative-price share moved more closely with wind than with solar in this pooled sample, but it does not assign causality or say that negative prices are exclusively wind events.
The evidence spans daily prices from 2021-01-01 through 2026-08-29 and warns that generation coverage and category completeness vary by zone. It registers within-family Holm control for inferential claims while making no unadjusted significance claim for this result. The corrected evidence intentionally reports no bootstrap interval for this correlation estimand. The result is public market research, not a household bill estimate, device recommendation, forecast guarantee, or trading strategy.
Plain-language answer
Both solar and wind moved positively with the daily share of negative-price intervals, but wind had the larger recorded correlation in this dataset. Wind’s Pearson value was 0.1490150194605299, compared with 0.055234686794402105 for solar. Positive values mean that days with more of the named generation category tended to have a larger share of negative intervals. They do not mean that every high-wind or high-solar day had a negative price.
The title’s “or both” matters. The evidence does not support classifying negative prices as belonging to a single technology. It compares two pooled associations and does not isolate demand, must-run output, outages, cross-border capacity, hydro conditions, storage, curtailment, or bidding behavior. The safe answer is that both co-moved positively, wind more strongly in the recorded comparison, and neither correlation is a causal attribution.
Research question
The research question is: when the daily share of negative day-ahead price intervals changes, which of two observed generation categories—solar or wind—has the stronger linear association with that share? The unit of comparison is Pearson correlation, so the result is standardized rather than expressed in electricity-price or generation units.
This is not a forecast test. It does not ask whether solar or wind known at a particular publication clock predicts a future negative-price event. It is also not an intervention study asking what prices would have been if one technology’s output were different. Those questions require as-of forecasts, causal identification, or a structural market model. The present paper only describes contemporaneous daily co-movement in the frozen data.
Data and provenance
The evidence declares daily price coverage from 2021-01-01 to 2026-08-29, detailed interval coverage from 2025-10-01 to 2026-08-29, and long-history coverage from 2015-01-01 to 2026-08-29. The metric is framed at daily frequency: negative native intervals are summarized as a daily share and compared with daily generation-category measures. The public JSON does not expose the zone-by-day panel or category-completeness mask, so the sample size of 44,437 should be understood as the registered analysis count, not reverse-engineered into an unsupported number of zones or complete days.
The source-table contract includes day_ahead_prices, generation_mix, border_flows, risk_accuracy, and zone_holidays. This result uses the price and generation concepts directly. Border flows, forecast-risk scores, and holidays may be relevant to companion research, but the evidence does not report a controlled model that holds them fixed. Their inclusion in the family contract must not be misrepresented as causal adjustment.
The current public-evidence JSON SHA-256 is 06d3c691a5d2b41a31a2ad170647ec7b067ccca6f0089cb56831afbe45ffdfaa, and the current figure SHA-256 is 1cdeb9404d2795ba0d9bcd546ed81da98c8880b00a51caa37f97e5541efd6c4e. The publication cutoff is 2026-08-30T00:00:00Z. The query ran read-only with a 180-second statement timeout. Analysis-code SHA-256 is 57c57de79cdab2b5b6d6c54c485cb5162598c5ba0b0bfe995da40d75e6c52ba9; protocol SHA-256 is adb36bf6b447af9f96339249b8becaefc20422499cca1977242866347a97bd4b; registry SHA-256 is 7bcb91d7476d0a69fe9fa75a5c7782f8117e0153f82f9112b7e1d307d3943717; snapshot SHA-256 is f77e3ae328f93916e53b1bab7516e1d0ac740a0dbf424cd2b73c81fee2559318; and source-registry SHA-256 is 07949550ac443ff673fda5c0209b99f137544f3ffecf6775f109bb9d09663bd6. The source registry was accessed on 2026-08-30. No assumptions are registered for this paper.
Method
For each included daily observation, the analysis derives the share of native day-ahead delivery intervals with a price below zero. It then pairs that outcome with daily solar and wind generation measures from the registered generation mix. Pearson correlation is computed separately for solar and wind. The larger of the two recorded correlations identifies the “stronger association” in the primary result.
This method compares scale-free linear association. It does not show a marginal effect in percentage points, and it does not tell us what happens after controlling for season, demand, installed capacity, zone, or network conditions. Solar has a strong time-of-day and seasonal profile; wind has different persistence and spatial structure. Aggregating to daily values can simplify these patterns, but it can also combine very different interval-level mechanisms into one number.
The registered method family covers episode survival, matched calendar controls, reliability scoring, and network lead-lag analysis. The evidence says within-family Holm control applies to inferential claims and labels this comparison descriptive. No corrected p-value or causal model is supplied. Therefore, the paper reports relative magnitude and direction only. It does not claim that one association is statistically different from the other.
Results
The solar association with daily negative-price share is r = 0.055234686794402105. The wind association is r = 0.1490150194605299. The primary result selects the latter as the stronger association and records 44,437 observations. Both signs are positive, while wind’s recorded linear co-movement is larger in magnitude.
The evidence’s registered interpretation is: “This descriptive comparison distinguishes solar and wind co-movement without assigning causality.” That statement governs the headline and the technology comparison.
These values do not support an exclusive label. A correlation of 0.1490150194605299 is not a probability that an event was caused by wind, a share of events attributable to wind, or a forecast accuracy score. Likewise, the solar value is not zero. The correct reading is comparative: in this pooled daily analysis, wind tracked variation in negative-interval share more closely than solar did.
The regenerated evidence stores bootstrap_95_interval as null and names the interval method “not reported for this estimand.” That intentional choice avoids unsupported interval inference for the comparison. The machine-readable figure labels solar and wind carry values 0.055234686794402105 and 0.1490150194605299, exactly matching the regenerated secondary results.
Robustness and placebo checks
The family’s multiplicity statement is the main registered inferential safeguard: within-family Holm control applies where inferential claims are made. This paper avoids converting descriptive associations into a discovery claim, so it does not publish an unadjusted significance result. The separate solar and wind estimates also prevent the headline from hiding the fact that both associations are positive.
Important robustness checks would include complete-case analyses by zone, zone-fixed comparisons, seasonal splits, installed-capacity normalization, native-interval rather than daily models, and sensitivity to days with partially missing generation categories. A placebo could shift generation to mismatched dates while retaining calendar structure. The evidence JSON supplies no numerical outputs from those checks; this paper therefore presents them as requirements for extension, not as completed results.
No formal interval comparison is reported for this estimand. This is an intentional uncertainty-handling choice. The robust public conclusion is limited to the two observed correlations, their ordering, and the exact machine-readable figure values.
Limitations
The explicit limitation is that generation coverage and category completeness vary by zone. Missing or differently classified generation can change both the included sample and the measured category totals. If completeness varies systematically with market, period, or technology, pooled associations may not represent a common European relationship.
Daily aggregation hides intraday alignment. Solar generation is concentrated in daylight, while a daily negative-interval share can include intervals outside that production window. Wind can persist across more of a day. The different temporal profiles alone can affect daily correlations. The evidence does not publish interval-level lag models here, so no mechanism is established.
The analysis also does not normalize for installed capacity, estimate curtailment, or distinguish available generation from metered output. It does not control for demand, imports, exports, outages, thermal constraints, storage, or bidding. It is not a household bill study: no retail price, consumption profile, device, or counterfactual schedule is measured. The working paper was model-assisted, is not peer reviewed, and should not be used as trading advice.
Practical implication
A household controller should not infer carbon content or device value from the label “negative price” alone, and it should not assume that every such interval is a solar-surplus event. The recorded comparison suggests wind co-movement was stronger at daily scale in this sample, but an operational schedule still needs the actual interval price curve, local generation or carbon data if relevant, and the device’s availability.
For alert design, explanations should say what is measured. “Price below zero” is a wholesale market observation; “high wind” or “high solar” is a generation observation; neither automatically describes the household’s retail charge. A transparent interface can present them side by side without asserting causality. This helps users avoid a simplistic technology story while preserving the useful fact that generation conditions and negative pricing often move together.
Reproducibility
A reproducer should validate the snapshot and code hashes, apply the publication cutoff, and document exactly how native negative intervals become a daily share. Generation records should be aggregated by category and day using a published timezone convention, with completeness checks for every zone-day. The analysis should then compute separate Pearson correlations for solar and wind over the same eligible sample and verify the registered count of 44,437.
The target outputs are r = 0.055234686794402105 for solar and r = 0.1490150194605299 for wind. Reproduction should report whether both estimates use identical rows and should expose any zone weighting or duplicate handling. It must preserve the intentional null interval and reproduce the figure labels and values exactly.
The public governance source is Voltcast’s Voltcast Research Content Plan. Assigned market and policy context is provided by Electricity 2026 from the International Energy Agency, Rewarding flexibility: How retail contract choice can help unlock consumer flexibility from ACER and CEER, EU electricity trading in the day-ahead markets becomes more dynamic from the European Commission, and Single Day-ahead Coupling (SDAC) from ENTSO-E. No unreported finding is attributed to those sources.
Disclosure
Analysis and drafting were model-assisted; sources, code, assumptions, and evidence hashes are disclosed. This working paper has not been peer reviewed. Its associations are descriptive, not causal. It is not a household bill study, does not estimate savings, and does not advise the selection of a retail tariff or energy device. It is not trading advice. No authors, dates, credentials, digital object identifiers, or external findings were invented.
References
iea-electricity-2026— International Energy Agency. Electricity 2026. Kind: official; source registry accessed 2026-08-30.acer-retail-2025— ACER and CEER. Rewarding flexibility: How retail contract choice can help unlock consumer flexibility. Kind: official; source registry accessed 2026-08-30.ec-sdac-15m— European Commission. EU electricity trading in the day-ahead markets becomes more dynamic. Kind: official; source registry accessed 2026-08-30.entsoe-sdac— ENTSO-E. Single Day-ahead Coupling (SDAC). Kind: official; source registry accessed 2026-08-30.volt-research-content— Voltcast. Voltcast Research Content Plan. Kind: canonical; registered URL:/docs/voltcast/RESEARCH-CONTENT-PLAN.md; source registry accessed 2026-08-30.