Are negative prices harder to forecast than positive prices?
Are negative prices harder to forecast than positive prices. Higher loss on realized negative-price days indicates event-specific forecast difficulty.
Abstract
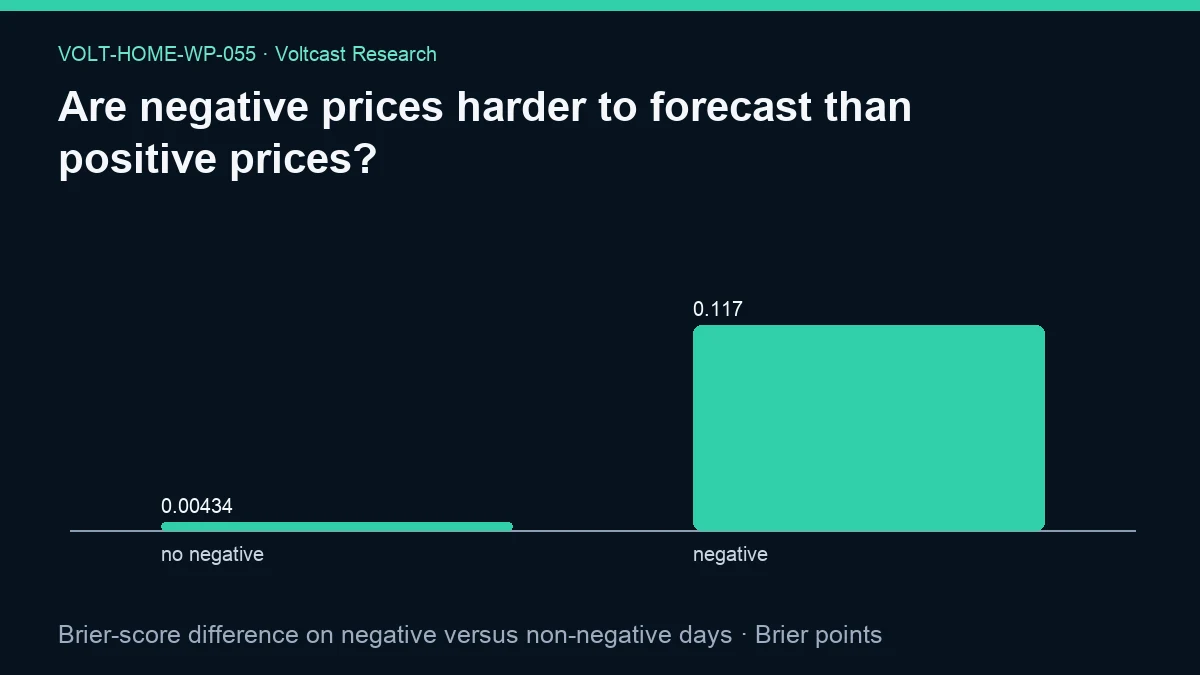
Negative-price event probabilities incur higher Brier loss on days when a negative-price interval actually occurs. The frozen evidence reports a negative-day minus non-negative-day Brier-score difference of 0.11307957313357844 Brier points. The negative-day subset contains 1644 model-version rows. Because lower Brier score is better, the positive difference indicates worse event-probability performance on realized negative-price days.
This comparison concerns the dedicated negative-price risk score, not the MAE of the full price curve. Its source is risk_accuracy, where rows identify model versions but are not joined to forecast_serving_lineage by the evidence extractor. The result must therefore not be described as customer-API live-service performance. It is model-version evidence across the recorded risk table. It also compares event and non-event days descriptively; event conditioning changes the distribution of the binary outcome and can change Brier loss even without isolating a causal difficulty mechanism. The paper is model-assisted, not peer reviewed, and makes no trading claim.
Plain-language answer
Yes, under the metric implemented here, days with at least one realized negative-price interval are harder for the recorded risk models. Their mean Brier loss exceeds the mean on days with no negative interval by 0.11307957313357844.
That answer needs two qualifications. First, this is about predicting whether and how much negative pricing occurs, not about forecasting every EUR/MWh price. Second, the rows are attached to model versions but not to an immutable serving decision. They can describe recorded model behavior, but they cannot establish that a particular version was the customer-facing model on each date. The result is useful for risk-model diagnosis, not for claiming a live product achieved or failed a promotion gate.
Research question
The question is whether negative-price regimes produce higher forecast loss than non-negative regimes. The implemented outcome splits risk-accuracy rows using observed_negative_share: a value greater than zero defines the negative group, and zero defines the comparison group. It then compares mean Brier scores.
Brier score is a proper score for probabilities of binary outcomes or aggregations of such outcomes. A lower value indicates probabilities closer to realized labels. The difference here is event-conditional, so it asks how loss changes on days when the event occurs. It does not ask whether the full price curve has higher MAE below zero, nor whether market coupling causes the difficulty. ENTSO-E's Single Day-ahead Coupling (SDAC) provides the institutional setting for coupled day-ahead prices, but the evidence alone does not assign the observed loss gap to coupling, renewable output, or any other driver.
Data and provenance
The evidence of record is the JSON URL in the frontmatter, frozen at 2026-08-30T00:00:00Z. The family declares forecast_accuracy, forecast_serving_lineage, risk_accuracy, generation_mix, and zone_temp_weighted. This paper's outcome uses risk_accuracy rows with non-null Brier score, observed negative share, horizon bucket, and model version.
The extractor does not perform a serving-lineage join for risk_accuracy. That is why the evidence limitation states that risk scores are model-version rows and do not imply customer-API promotion. This boundary is binding. The production aggregate was extracted SELECT-only in a read-only transaction with a 180-second statement timeout.
The snapshot SHA-256 is 7e97489fc8528c8cc8c38830e05b48d949ce1f67b98575dff26f5d7c321e4c67. The analysis-code, protocol, registry, and source-registry hashes are 57c57de79cdab2b5b6d6c54c485cb5162598c5ba0b0bfe995da40d75e6c52ba9, adb36bf6b447af9f96339249b8becaefc20422499cca1977242866347a97bd4b, 7bcb91d7476d0a69fe9fa75a5c7782f8117e0153f82f9112b7e1d307d3943717, and 07949550ac443ff673fda5c0209b99f137544f3ffecf6775f109bb9d09663bd6. The evidence and figure hashes are 9ae7a1f0d3caba03f52880a1ee796ee7a8dd00a7228225fc9a0ab4ac58c0172a and 5408930f90caf0b8361413a24e16724afa6e0dfebf1bb636e90264ab98b133e3.
Method
The analysis retains every risk_accuracy row with a non-null Brier score. It assigns rows with observed negative share greater than zero to the event group and rows with observed negative share equal to zero to the non-event group. It calculates each group's arithmetic mean Brier score and subtracts the non-event mean from the event mean. The primary sample is the list of event-group Brier scores, whose size is 1644.
No version is retrospectively relabeled as a serving champion. The Objective-specific seven-day forecast promotion requires model objectives to remain separate and serving decisions to be appended only after their own gates. The Volt 6.1 cross-zone price model card concerns a price-distribution replacement programme that failed and never served. Its price-model objectives, development scores, and architecture are not evidence for this negative-risk result.
Results
The event-group mean Brier score is 0.11741827250608272, compared with 0.004338699372504278 for the non-event group, a difference of 0.11307957313357844 Brier points. In the direction of the score, that is worse performance on realized negative-price days. The event-group sample size is 1644 model-version rows.
The regenerated evidence records bootstrap_95_interval as null and the interval method as “not reported for this estimand.” No uncertainty interval accompanies the 0.11307957313357844 difference, and this paper makes no statistical-significance claim.
The result does not identify which model versions, zones, horizons, or seasons contribute most to the gap. It also does not report a baseline-relative Brier skill score in this outcome. Those omissions prevent claims about promotion, live superiority, or a universally harder market regime.
Robustness and placebo checks
The grouping rule is transparent and uses the realized negative share already present in the risk score record. All registered model versions remain eligible; the analysis does not select only favorable versions. The score direction is fixed in advance, which prevents a positive loss difference from being reframed as an improvement.
However, serving lineage is unavailable for this outcome. That means the strongest live-service anti-survivorship control used elsewhere in this cluster is absent. A future audit should join the risk score to an immutable risk-serving lineage, if such a contract exists, and distinguish promoted, shadow, and development versions.
No matched-calendar placebo, equal-prevalence resampling, zone fixed effect, horizon stratum, or climatology-relative comparison is reported. The regenerated evidence reports no blocked uncertainty interval, so temporal dependence is not quantified. The result remains descriptive and makes no within-family significance claim requiring Holm adjustment.
Limitations
Event-conditional Brier comparisons can be difficult to interpret. Brier loss depends on both issued probability and realized label. Conditioning on event occurrence selects one side of the label distribution and can raise average loss whenever probabilities are generally below certainty. It does not, by itself, establish that model inputs are less informative on negative days.
The event definition is any observed negative share greater than zero. It does not distinguish one negative interval from a long negative episode, nor shallow from deeply negative prices. The public JSON does not expose those strata. It also does not report sample size for the non-event group.
Most importantly, model-version rows are not serving-lineage matches. The finding must not be presented as a claim about the current customer API, the production-main champion, or any one named model. A model may appear in the table for evaluation without having served. The exact version and objective are part of the evidence identity, not interchangeable labels.
The comparison also pools horizon buckets. Event prevalence and the information available to a forecaster can differ substantially with lead time, so a pooled loss gap need not describe any one horizon. Brier scores from different event definitions would likewise be incomparable, but the public aggregate does not provide an event-schema identity beyond the recorded risk fields. A follow-up should bind label semantics, horizon, model objective, and serving state before estimating a policy-relevant gap. Until then, the result is a broad diagnostic of the recorded risk rows.
Practical implication
Users of negative-price probabilities should expect the most decision-relevant event days to require separate calibration monitoring. Average Brier scores dominated by non-event days can look reassuring while performance on realized events remains weak. Public scorecards should therefore show event-day loss, baseline-relative performance, horizon, and version rather than only a single pooled average.
Automation should not interpret a low event probability as proof that negative prices cannot occur. Device controllers need explicit fallbacks and physical constraints. For model operators, the next improvement target is prospective event calibration under a recorded risk-serving lineage, not retrospective selection of a better historical version. The Voltcast Research Content Plan requires poor event performance to be published with the same prominence as successes.
Reproducibility
Verify the evidence file, its manifest hash, and the snapshot, code, protocol, and registry hashes. Read non-null Brier rows from risk_accuracy. Split them by whether observed_negative_share is greater than zero or equal to zero. Calculate the two means and subtract the latter from the former. Preserve model version and horizon metadata even though the public aggregate pools them.
A stronger study should register a serving-lineage join, match event and non-event days on zone, horizon, season, and model version, compare against trailing climatology, and block-resample dates. It should stratify event duration and depth without reusing this frozen outcome as a promotion gate. The assigned Google Search Central Article structured data guidance supports machine-readable publication and evidence metadata; it is not empirical support for the Brier result.
Disclosure
Analysis and drafting were model-assisted. The language model summarized the frozen model-version evidence and preserved its non-serving limitation. It supplied no empirical observation. Sources, code, assumptions, limitations, and hashes are disclosed. This working paper is not peer reviewed.
Volt has zero live traders and zero live capital. C0R is the only paper strategy. Production forecasting is non-trading. This event-score analysis is not trading advice, financial advice, a customer-savings claim, or permission to promote any model version.
References
- Voltcast. “Objective-specific seven-day forecast promotion.” https://github.com/ossedk/voltcast/blob/main/docs/voltcast/OBJECTIVE-PROMOTION-POLICY.md
- Voltcast. “Volt 6.1 cross-zone price model card.” https://github.com/ossedk/voltcast/blob/main/docs/voltcast/V6.1-MODEL-CARD.md
- Voltcast. “Voltcast Research Content Plan.” https://github.com/ossedk/voltcast/blob/main/docs/voltcast/RESEARCH-CONTENT-PLAN.md
- Google Search Central. “Article structured data.” https://developers.google.com/search/docs/appearance/structured-data/article
- ENTSO-E. “Single Day-ahead Coupling (SDAC).” https://www.entsoe.eu/network_codes/cacm/implementation/sdac/