How quickly does forecast skill decay from day one to day seven?
How quickly does forecast skill decay from day one to day seven. Exact-horizon lineage prevents a day-one score from being presented as seven-day skill.
Abstract
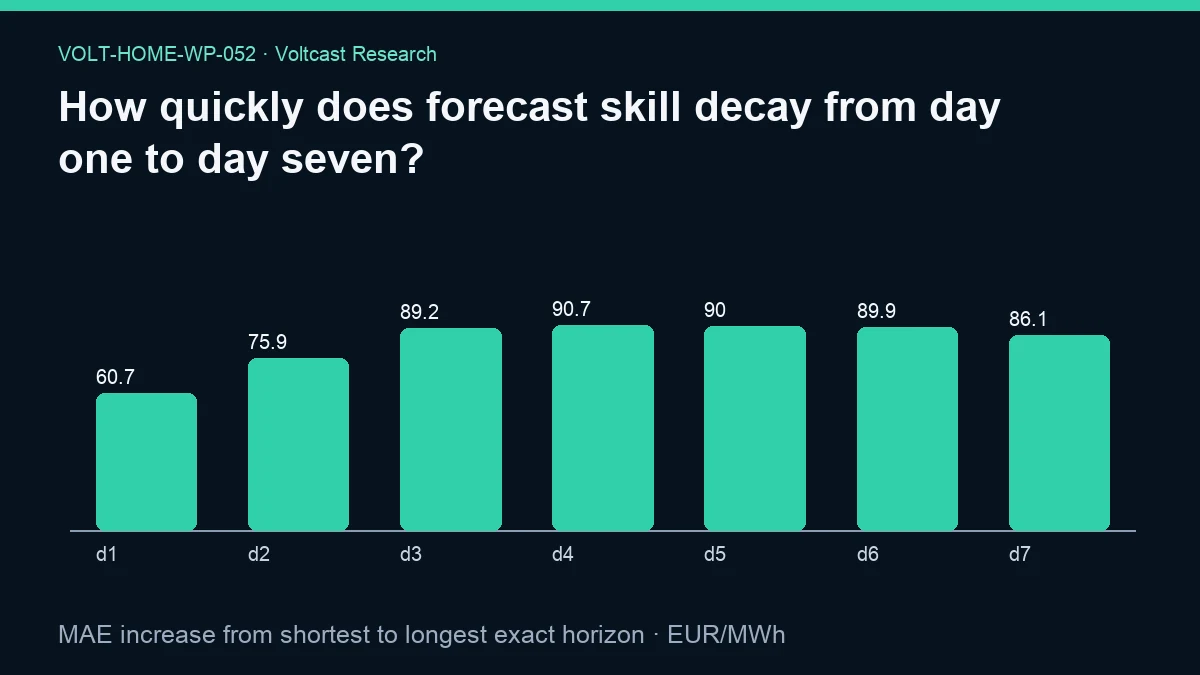
Seven-day forecast claims can be misleading when short and long horizons are mixed. This paper measures the difference between the mean absolute error (MAE) at the longest and shortest exact horizons in the frozen serving record. The measured increase is 25.375216403577852 EUR/MWh, based on 17750 lineage-matched accuracy rows. The figure preserves the complete d1-through-d7 sequence: 60.718384096109844, 75.86942822966508, 89.23258108192621, 90.66425893915756, 89.97785701917131, 89.86564108091223, and 86.0936004996877 EUR/MWh.
Eligibility is strict: a row counts as live-service evidence only when its model version exactly matches the immutable serving-lineage record for the same bidding zone, delivery date, and horizon bucket. Development models, reconstructed proxies, and versions promoted for a different objective are excluded. The result says that the longest served horizon was less accurate on average in absolute-error terms than the shortest served horizon. It does not show that error rises smoothly every day, nor that every zone has the same decay curve. It is descriptive, model-assisted, and not peer reviewed.
Plain-language answer
In this record, moving from the shortest exact served horizon to the longest exact served horizon adds 25.375216403577852 EUR/MWh to mean absolute error. That is the direct answer supported by the evidence. A day-one score should not be presented as evidence of day-seven skill, because the information available to the model and the uncertainty around the target change with lead time.
The result is a fleet-level endpoint contrast. It does not mean that each successive day adds an equal amount of error. Some zones may have flatter profiles; some dates may become difficult abruptly; and horizon composition can differ across markets. Users planning a device several days ahead should therefore inspect the score for the exact horizon they intend to use. A good next-day curve is not a warranty for a week-ahead curve.
Research question
The preregistered question asks how quickly forecast skill decays from day one to day seven. The operational estimand is the longest-horizon mean MAE minus the shortest-horizon mean MAE among rows that are both scored and serving-lineage matched. The word “skill” is used cautiously here: the headline is an error difference, not a normalized skill score relative to a common baseline.
The exact-horizon requirement matters because a seven-day API can contain materially different information sets. The day-one forecast can use more recent prices, weather runs, and system observations than the day-seven forecast. ENTSO-E's Single Day-ahead Coupling (SDAC) explains the coupled institutional setting for the target prices, but it does not imply identical predictability across horizons or zones. This paper measures the served record rather than deriving predictability from the market design.
Data and provenance
The evidence is the frozen public JSON named in the frontmatter. Its cutoff is 2026-08-30T00:00:00Z. The family declares forecast_accuracy, forecast_serving_lineage, risk_accuracy, generation_mix, and zone_temp_weighted; the endpoint calculation uses the first two. Eligible rows have non-null MAE and an exact match between the scored model_version and the served_model_version for zone, delivery date, and horizon bucket.
The source snapshot covers the declared production windows without exposing the temporary aggregate input. Its SHA-256 is 7e97489fc8528c8cc8c38830e05b48d949ce1f67b98575dff26f5d7c321e4c67. The analysis code, protocol, registry, and source-registry hashes are 57c57de79cdab2b5b6d6c54c485cb5162598c5ba0b0bfe995da40d75e6c52ba9, adb36bf6b447af9f96339249b8becaefc20422499cca1977242866347a97bd4b, 7bcb91d7476d0a69fe9fa75a5c7782f8117e0153f82f9112b7e1d307d3943717, and 07949550ac443ff673fda5c0209b99f137544f3ffecf6775f109bb9d09663bd6. The evidence and figure hashes are c0cf5879c6b637b66b38131368f9a9f2ce4dcdf31817120d763731e3aee4ab6a and ccd3a051723f3153b11118d5d363d325cd9332bba8c215eab840f01ebcf52709. Extraction was SELECT-only in a read-only transaction with a 180-second statement timeout.
Method
The analysis groups all eligible MAE rows by integer horizon_days. It calculates the arithmetic mean MAE within each nonzero exact horizon, sorts those horizon means, and subtracts the first from the last. The chart labels d1, d2, d3, d4, d5, d6, and d7, establishing that the displayed profile covers the full served sequence. The headline reports only the endpoint increase.
This is deliberately different from choosing the best model at each horizon after seeing outcomes. The Objective-specific seven-day forecast promotion requires exact-horizon evidence and keeps point, quantile, external-challenger, and customer-production objectives separate. The Volt 6.1 cross-zone price model card describes a development programme spanning exact horizons, but that version failed its registered gate and never became serving evidence. Its offline proxy scores are not inserted into this live-service curve.
Results
The shortest-to-longest exact-horizon MAE increase is 25.375216403577852 EUR/MWh. The sample field reports 17750 underlying lineage-matched MAE rows. Positive endpoint change means the longest exact horizon had higher average absolute error than the shortest exact horizon in the frozen serving record.
The regenerated evidence publishes no uncertainty interval for the 25.375216403577852 endpoint contrast and identifies the interval method as “not reported for this estimand.” No significance claim is made.
The figure contains the horizon means used for the visual profile: d1 60.718384096109844, d2 75.86942822966508, d3 89.23258108192621, d4 90.66425893915756, d5 89.97785701917131, d6 89.86564108091223, and d7 86.0936004996877 EUR/MWh. These values show that the profile is non-monotonic even though the endpoint difference is positive.
Robustness and placebo checks
Serving-lineage matching is the principal anti-survivorship control. A scored version that was not the recorded serving choice for its zone, date, and horizon cannot improve or worsen the live curve. Exact-horizon grouping is the second control: it prevents a dense collection of short-horizon rows from being described as seven-day evidence. Objective separation prevents a point-only benchmark model from being silently treated as a probabilistic customer forecast.
Several useful placebos are not in the frozen evidence. There is no shuffled-horizon test, balanced zone-date panel, same-model-only profile, or comparison with a horizon-invariant persistence baseline. No uncertainty interval is reported, so serial dependence and cross-horizon dependence are not quantified. The multiplicity statement correctly limits this output to a descriptive result without an unadjusted inferential claim.
Limitations
MAE is denominated in EUR/MWh and can be influenced by zone price scale and event regimes. Pooling zones means a change in the mix of markets observed at longer horizons could contribute to the endpoint difference. The public evidence does not provide matched counts by zone and horizon, so a balanced within-zone decay estimate cannot be reconstructed from the paper-level aggregate.
The headline does not reveal shape. Error could rise steadily, remain flat before a late jump, or vary non-monotonically. Nor does the analysis separate forecast versions. Serving lineage makes each row historically honest, but the serving model can change over time. The endpoint contrast therefore measures the production service as operated, not the intrinsic decay curve of one fixed algorithm.
Finally, “skill decay” is broader than MAE growth. Proper probabilistic scores, interval coverage, calibration, and decision utility can decay differently. A model can retain median accuracy while its tails become underdispersed. The objective-specific policy requires those outputs to be evaluated separately; this paper does not collapse them into one score.
The endpoint statistic also cannot establish when additional information becomes valuable. Forecast updates between horizons may arrive on different schedules, and a horizon label alone does not identify the weather or market vintages available to the model. A causal account of decay would need those receipt clocks as covariates.
Practical implication
Household automation should bind each decision to the relevant exact horizon. A controller scheduling tomorrow can use the day-one record; a planner reserving energy several days ahead should use the matching longer-horizon score and wider uncertainty. The measured 25.375216403577852 EUR/MWh endpoint increase is a warning against applying the shortest-horizon accuracy badge to the entire week.
For model operators, the result supports per-horizon promotion and rollback. A candidate that improves d1 but degrades d7 should not replace a seven-day customer contract. This is why the production-main policy requires the complete horizon set and why point-only external evidence remains a separate objective. The Voltcast Research Content Plan also requires the data window and losing results to remain visible instead of compressing them into a favorable headline.
Reproducibility
A reproducer should verify the evidence file and manifest hash, then verify the snapshot, code, protocol, and registry SHA-256 values. Join scored accuracy to serving lineage on zone, delivery date, horizon bucket, and exact model version. Reject non-matches and null MAEs. Group by nonzero horizon_days, calculate each mean, sort horizons, and subtract the shortest mean from the longest.
To strengthen—not restate—the result, a new protocol could restrict to a common set of zone-dates with all seven horizons, estimate paired within-zone changes, and block-resample delivery weeks. It could also compare fixed model versions and common persistence baselines. Those would answer different estimands and must be published as new evidence. Google Search Central's assigned Article structured data source supports exposing the stable title, date, image, and evidence linkage in the public rendering.
Disclosure
Analysis and drafting were model-assisted; sources, code, assumptions, and evidence hashes are disclosed. The model wrote explanatory prose around the frozen aggregate and did not supply empirical values. This working paper is not peer reviewed.
Volt has zero live traders and zero live capital. C0R is the only paper strategy. Production forecasting is a non-trading service. This horizon analysis is not a trading system and does not authorize capital. It is not trading advice or financial advice, and it does not estimate a household's retail bill or promise savings.
References
- Voltcast. “Objective-specific seven-day forecast promotion.” https://github.com/ossedk/voltcast/blob/main/docs/voltcast/OBJECTIVE-PROMOTION-POLICY.md
- Voltcast. “Volt 6.1 cross-zone price model card.” https://github.com/ossedk/voltcast/blob/main/docs/voltcast/V6.1-MODEL-CARD.md
- Voltcast. “Voltcast Research Content Plan.” https://github.com/ossedk/voltcast/blob/main/docs/voltcast/RESEARCH-CONTENT-PLAN.md
- Google Search Central. “Article structured data.” https://developers.google.com/search/docs/appearance/structured-data/article
- ENTSO-E. “Single Day-ahead Coupling (SDAC).” https://www.entsoe.eu/network_codes/cacm/implementation/sdac/