Are P10, P50, and P90 price forecasts actually calibrated?
Are P10, P50, and P90 price forecasts actually calibrated. Lower deviation means observed interval coverage is closer to the declared probability.
Abstract
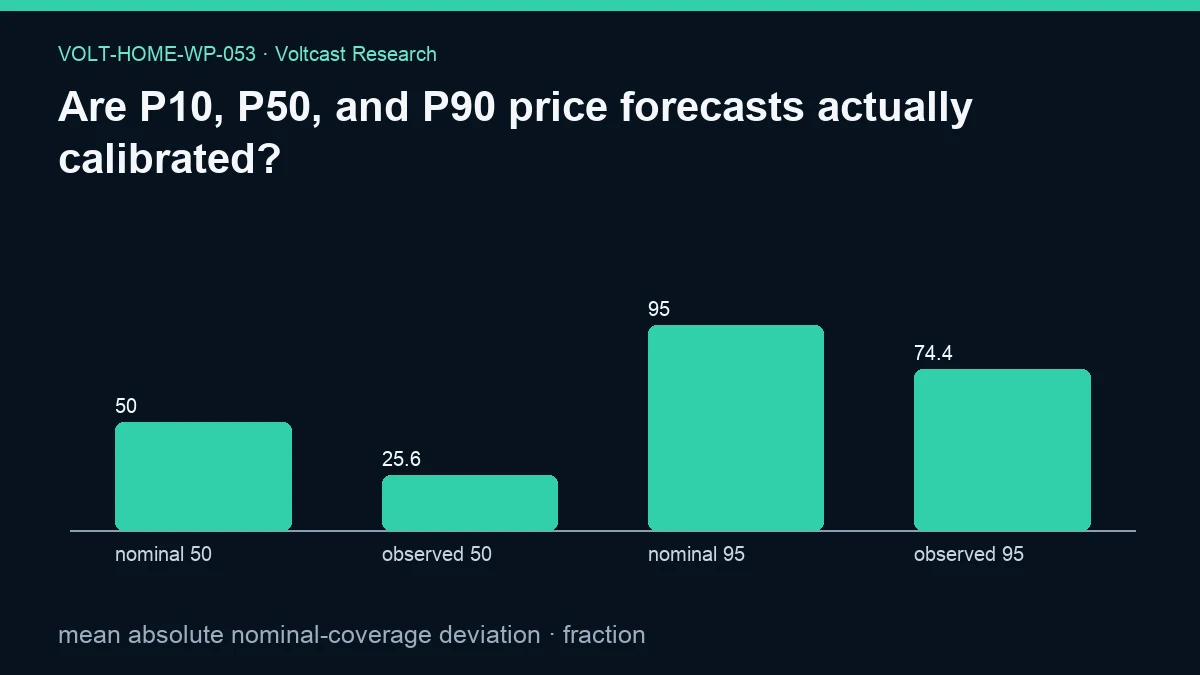
The frozen serving record shows substantial undercoverage in the interval metrics that were measured. Across 25220 coverage observations, mean absolute deviation from nominal interval coverage is 0.25785235130848533. Mean observed coverage for the nominal central interval recorded as coverage_50 is 0.2560121015067407, while mean observed coverage_95 is 0.7438494290245837. Both are below their nominal targets.
This result is an important calibration warning, but it is not a complete calibration test of the individual P10, P50, and P90 quantiles named in the title. The evidence generator uses the recorded coverage-50 and coverage-95 fields; it does not evaluate P10 exceedance frequency, median bias, P90 exceedance frequency, probability integral transforms, or quantile-specific reliability. The honest answer is therefore two-part: the measured central intervals are materially underdispersed on the lineage-matched serving record, while individual P10/P50/P90 calibration remains incompletely identified by this paper's frozen estimand. Model versions and serving objectives remain separate throughout.
Plain-language answer
The uncertainty bands in the measured record are too narrow on average. A nominal interval intended to cover half of outcomes covers a mean fraction of 0.2560121015067407; the wider interval recorded with a nominal target of 0.95 covers 0.7438494290245837. The average absolute gap from those nominal targets is 0.25785235130848533.
That does not automatically tell us whether P10 alone is too high or too low, whether P50 is biased, or whether P90 alone is too high or too low. Coverage can fail because one boundary is wrong, both are wrong, or the distribution is conditionally miscalibrated in certain zones or horizons. The evidence supports “the intervals under-cover,” not “each named quantile has been individually diagnosed.” A household user should treat the bands as historical uncertainty estimates with a disclosed calibration shortfall, not as guaranteed containment ranges.
Research question
Calibration means that forecast probabilities agree with observed frequencies over an appropriate sequence of comparable cases. For an interval, observed inclusion should match nominal coverage. For an individual quantile, the outcome should fall below that threshold at the corresponding long-run frequency, subject to sampling uncertainty and conditioning. Median calibration additionally asks whether outcomes fall above and below the median in a balanced way.
The preregistered title asks about P10, P50, and P90. The implemented outcome instead measures the absolute deviations of coverage_50 from 0.5 and coverage_95 from 0.95, then averages those deviations. This is related to distributional calibration but not identical to testing the three named quantiles. The distinction matters because the Objective-specific seven-day forecast promotion keeps quantile coverage and median accuracy as separate gates rather than assuming one validates the other.
Data and provenance
The evidence JSON is frozen at the URL in the frontmatter with publication cutoff 2026-08-30T00:00:00Z. The declared contracts are forecast_accuracy, forecast_serving_lineage, risk_accuracy, generation_mix, and zone_temp_weighted. This analysis uses scored forecast rows with non-null MAE that also match immutable serving lineage, then selects non-null coverage_50 and coverage_95 fields.
The extraction was SELECT-only and read-only, with a 180-second statement timeout. The snapshot SHA-256 is 7e97489fc8528c8cc8c38830e05b48d949ce1f67b98575dff26f5d7c321e4c67. Analysis-code, protocol, registry, and source-registry hashes are 57c57de79cdab2b5b6d6c54c485cb5162598c5ba0b0bfe995da40d75e6c52ba9, adb36bf6b447af9f96339249b8becaefc20422499cca1977242866347a97bd4b, 7bcb91d7476d0a69fe9fa75a5c7782f8117e0153f82f9112b7e1d307d3943717, and 07949550ac443ff673fda5c0209b99f137544f3ffecf6775f109bb9d09663bd6. The evidence and figure hashes are c856e73715c61ded4f1e046522f58ffc6cd61d0941302d3aee2a4dad1d58b294 and 1c12f88520a3a5779b82b734f2a8916fd811413749f059325c625725f33e31a9. These hashes bind the prose to one aggregate outcome rather than an editable dashboard.
Method
For every eligible coverage-50 value, the analysis calculates its absolute distance from 0.5. For every eligible coverage-95 value, it calculates its absolute distance from 0.95. It combines both sets of distances and takes their arithmetic mean. The sample size 25220 is the number of combined coverage observations used by that calculation. Secondary outputs separately report the means of the two coverage fields.
The calculation pools serving versions, zones, dates, and horizons. That is valid for a fleet-level descriptive audit but not for a champion decision. Quantile promotion requires a model to supply the complete probabilistic contract and pass exact policy gates. The Volt 6.1 cross-zone price model card documents nine-quantile development models, but Volt 6.1 failed its replacement gate and never served. Its offline results are not mixed into this production-serving analysis, and its architecture does not excuse the observed coverage record.
Results
The primary result is a mean absolute nominal-coverage deviation of 0.25785235130848533. Mean coverage_50 is 0.2560121015067407 and mean coverage_95 is 0.7438494290245837. The figure expresses those fractions as 25.60121015067407% observed coverage against 50% nominal and 74.38494290245838% observed coverage against 95% nominal. In both cases, observed coverage is below nominal coverage. The direction is consistent with underdispersed forecast intervals: realized prices fall outside the reported bands more often than the interval labels imply.
The regenerated evidence records bootstrap_95_interval as null and the interval method as “not reported for this estimand.” No uncertainty interval accompanies the mean absolute nominal-coverage deviation of 0.25785235130848533.
No empirical result in the JSON reports P10 hit frequency, P50 directional balance, or P90 hit frequency. The title question cannot be answered more specifically without inventing evidence. The measured conclusion is interval undercoverage and incomplete quantile-specific identification.
Robustness and placebo checks
Exact serving-lineage matching blocks a hindsight model swap. A development candidate, failed gate, or historical proxy cannot enter simply because it has more attractive coverage after outcomes are observed. Objective-specific policy also prevents a point-only model with no valid tails from being treated as a calibrated distribution.
The paper has no calibration placebo by zone, horizon, season, or model version. It does not compare observed coverage with randomized intervals of equal width or with a simple empirical-residual baseline. It also does not report sharpness, so a trivially wide interval is not directly penalized here. The regenerated evidence reports no blocked uncertainty interval. Accordingly, the result is descriptive; within-family Holm control is not invoked to make a significance claim.
Limitations
Pooling can hide offsetting failures. Some zone-horizon cells may over-cover while others severely under-cover. A fleet mean does not demonstrate conditional calibration. The sample also mixes whichever versions were genuinely served, so it describes the operational system over time rather than one fixed model.
Coverage alone does not reward sharpness. Wider bands tend to cover more outcomes, but may be less useful. Proper scoring rules such as weighted interval score or CRPS balance calibration and concentration; they are not the headline here. Nor does the evidence isolate whether misses occur above or below the bands, which is essential for diagnosing P10 and P90 asymmetry.
The mismatch between the title and implemented estimand is itself a limitation. coverage_50 and coverage_95 do not constitute a full P10/P50/P90 reliability study. A new paper would need quantile-hit indicators, median bias, cell-level sample floors, blocked uncertainty, and correction across the family. This frozen result cannot be silently expanded.
The aggregate also gives each recorded coverage value equal influence. It does not expose whether a cell summarizes the same number of delivery periods as another cell, whether the underlying price intervals were complete, or whether coverage was computed identically across every historical model version. Those questions belong to the score contract and should be verified before a version-level diagnosis. This paper can identify undercoverage in the frozen aggregate, but it cannot reconstruct the full distribution of misses from paper-level fields.
Practical implication
Users should not interpret P10 and P90 as hard lower and upper bounds. They are probabilistic summaries whose usefulness depends on demonstrated calibration at the relevant zone, horizon, and model version. The undercoverage measured here argues for conservative automation: retain device constraints, validate freshness, and avoid treating a forecast band as a safety guarantee.
For model operators, calibration must be an explicit promotion requirement rather than a cosmetic chart. The production policy correctly refuses to let point accuracy replace a complete quantile contract. Recalibration, wider intervals, or a new model may be candidates, but each requires prospective lineage-matched evidence. The Voltcast Research Content Plan requires this shortfall to remain as visible as a successful accuracy result.
Reproducibility
Verify the paper ID, slug, evidence hash, and all provenance hashes. Join forecast_accuracy to forecast_serving_lineage on zone, delivery date, horizon bucket, and exact model version. Retain eligible rows, extract non-null coverage-50 and coverage-95 values, calculate absolute deviations from their nominal targets, combine the deviations, and average them. Separately average each coverage field to reproduce the secondary results.
A stronger follow-up should retain zone, horizon, date, and model-version strata; calculate quantile-specific hit rates; assess median bias; report sharpness and proper scores; and block-resample dates. It should be preregistered as new evidence. The public document uses the assigned Google Search Central Article structured data guidance to expose its title, publication date, image, and evidence link. ENTSO-E's Single Day-ahead Coupling (SDAC) provides market context, not calibration evidence.
Disclosure
Analysis and drafting were model-assisted. The model was used to explain a frozen aggregate and to identify the boundary between interval coverage and quantile-specific calibration. It did not generate empirical values. Sources, assumptions, code, and hashes are disclosed. This working paper is not peer reviewed.
Volt has zero live traders and zero live capital. C0R is the only paper strategy. Production forecasting is non-trading. This paper is not trading advice or financial advice, makes no customer-savings claim, and authorizes no model promotion.
References
- Voltcast. “Objective-specific seven-day forecast promotion.” https://github.com/ossedk/voltcast/blob/main/docs/voltcast/OBJECTIVE-PROMOTION-POLICY.md
- Voltcast. “Volt 6.1 cross-zone price model card.” https://github.com/ossedk/voltcast/blob/main/docs/voltcast/V6.1-MODEL-CARD.md
- Voltcast. “Voltcast Research Content Plan.” https://github.com/ossedk/voltcast/blob/main/docs/voltcast/RESEARCH-CONTENT-PLAN.md
- Google Search Central. “Article structured data.” https://developers.google.com/search/docs/appearance/structured-data/article
- ENTSO-E. “Single Day-ahead Coupling (SDAC).” https://www.entsoe.eu/network_codes/cacm/implementation/sdac/