Can neighboring-zone prices improve a simple local forecast?
Can neighboring-zone prices improve a simple local forecast. This is a deliberately simple benchmark, not a production model promotion.
Abstract
Neighboring electricity zones share weather, fuel conditions, interconnection, and market coupling, so a neighbor’s price might contain information about a local zone. This paper tests the simplest possible version of that idea. For every represented directed border and successive available date, it forecasts the local zone’s current daily mean price in two ways: yesterday’s local daily mean and yesterday’s neighboring-zone daily mean. It compares their absolute errors.
The reported metric is mean local-persistence error minus mean neighbor-persistence error. Positive values would indicate improvement from the neighbor. Across 352,670 forecast instances, the value is -193.6456826 EUR/MWh. The neighbor-based benchmark therefore has mean absolute error about 193.646 EUR/MWh higher than local persistence in this pooled implementation. It does not improve the simple local baseline.
This is a deliberately weak benchmark, not a full cross-zone forecasting model. It does not estimate weights, use multiple neighbors, control for stable price-level differences, normalize zones, or enforce a live issuance clock. Repeated links and dates create dependence, and adjacent sorted observations may include date gaps. The result should not be generalized to every possible cross-zone feature. It shows that blindly replacing yesterday’s local mean with yesterday’s neighbor mean performs badly under the frozen daily-panel specification. No production model is promoted, and nothing here is trading advice.
Plain-language answer
Not in this simple test. Using the previous observation’s local price is much better than using the previous observation’s neighboring-zone price as a direct substitute.
The metric is designed so that a positive number favors the neighbor. Instead, it is -193.646 EUR/MWh across 352,670 comparisons. That means the average absolute error of the neighbor-price persistence rule exceeds the local persistence rule by about 193.646 EUR/MWh.
This does not prove that neighboring information is useless. A better model could use changes rather than levels, learn border-specific offsets, combine several neighbors, include flow and capacity conditions, or reject stale observations. Those possibilities were not tested here. For a household product, the immediate lesson is that a neighbor’s raw price should not replace the local curve without validated modeling.
Research question
The registered question is whether neighboring-zone prices can improve a simple local forecast. The exact comparison asks whether one particular neighbor-level persistence rule has lower mean absolute error than one local-level persistence rule for daily mean prices.
For target zone A and neighboring zone B, the local baseline predicts A’s current daily mean with A’s previous observed daily mean. The challenger predicts A’s current daily mean with B’s previous observed daily mean. Absolute errors are accumulated over each represented directed link. Improvement is baseline error minus challenger error.
This formulation makes the sign clear but sets a demanding and somewhat naive task for the neighbor: it must predict the local price level without an estimated offset. It is not a test of whether yesterday’s neighbor change improves a local baseline, whether cross-zone features help a multivariate model, or whether the input is available before a real household decision. Those are separate questions.
Data and provenance
The public aggregate is /research-data/home-papers/can-neighboring-zone-prices-improve-a-simple-local-forecast.json. Status is measured; publication cutoff is 2026-08-30T00:00:00Z. The corpus records daily-price data from 2021-01-01 through 2026-08-29. It also records detailed intervals from 2025-10-01 and long price history from 2015-01-01, but this benchmark predicts daily means.
The grid family allows border_flows, day_ahead_prices, outage_events, generation_mix, and zone_load. Flow-link identities establish which zone pairs are neighbors in the analysis, and daily price rows supply targets and predictors. The reported benchmark does not include flow magnitude, outages, generation mix, or load as features.
The snapshot was accessed read-only with a 180-second timeout. The snapshot SHA-256 is 7e97489fc8528c8cc8c38830e05b48d949ce1f67b98575dff26f5d7c321e4c67. Analysis code is identified by 57c57de79cdab2b5b6d6c54c485cb5162598c5ba0b0bfe995da40d75e6c52ba9, protocol by adb36bf6b447af9f96339249b8becaefc20422499cca1977242866347a97bd4b, the paper registry by 7bcb91d7476d0a69fe9fa75a5c7782f8117e0153f82f9112b7e1d307d3943717, and the source registry by 07949550ac443ff673fda5c0209b99f137544f3ffecf6775f109bb9d09663bd6.
The ENTSO-E source explains why cross-zone information is economically plausible in a coupled market. The European Commission source documents the finer market-time-unit environment. The IEA provides wider grid and flexibility context. ACER and CEER explain why reliable price information can matter under flexible retail contracts. Voltcast’s architecture documents the price contracts and forecast separation. None of these contextual sources supplies the measured error difference.
Method
The common routine creates the set of directed (local_zone, neighbor_zone) links from matched flow-price rows. It also builds a set of available dates for each zone. For every link, it intersects the local and neighbor date sets, retrieves both zones’ daily price rows for those common dates, and sorts them by date.
Starting at the second sorted row, the current local mean price is the target. The local-persistence error is the absolute difference between that target and the preceding row’s local mean price. The neighbor-persistence error is the absolute difference between the target and the preceding row’s neighbor mean price.
The final statistic is:
mean(local absolute errors) - mean(neighbor absolute errors).
The evidence sample contains the 352,670 neighbor errors. A negative result means the neighbor has larger MAE. The method does not enforce exact calendar adjacency, so “previous” means the preceding common observation rather than necessarily yesterday. It does not estimate on a training set or score on a locked holdout; the rules themselves have no fitted parameters.
The regenerated evidence reports no bootstrap interval and names the interval method “not reported for this estimand.” It therefore provides no uncertainty bound for the paired MAE improvement, and this paper makes no significance claim.
Results
Across 352,670 directed-link forecast instances, the neighbor-price persistence MAE improvement over local persistence is -193.64568264383135 EUR/MWh. Rounded to three decimals, the neighbor rule is worse by 193.646 EUR/MWh in average absolute error.
The sign is unambiguously unfavorable under the preregistered definition. A raw previous neighbor price does not improve the raw previous local price for predicting the local daily mean in this sample.
The magnitude likely reflects large stable differences and heterogeneity among some paired price series as well as ordinary forecast failure, but the public evidence does not decompose it. No secondary results identify borders, zones, seasons, date gaps, or price regimes responsible for the difference.
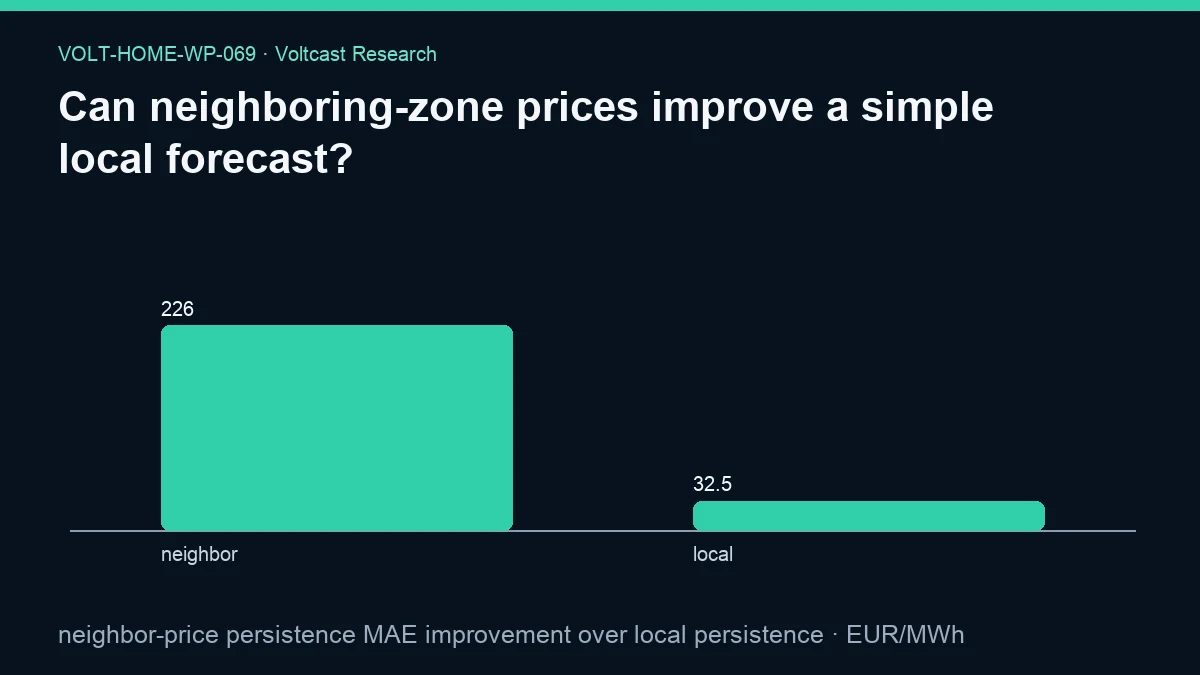
The figure labels are “neighbor” and “local,” with MAE values 226.15338713131257 and 32.50770448748121 EUR/MWh, rendered as 226 and 32.5. Local minus neighbor equals the primary -193.64568264383135 EUR/MWh improvement metric. The current evidence reports no interval for that difference.
Robustness and placebo checks
The strongest feature of the design is its transparent baseline. Both predictors use only the previous common observation, both target the same current local mean price, and both are scored with absolute error. There is no model tuning or hidden feature selection.
The comparison should still be paired at the forecast-instance level for inferential work, because both errors share the same target. Repeated instances from the same zone, link, and date are dependent. The public artifact does not provide a paired block bootstrap or multiplicity-adjusted test.
Important robustness checks remain unreported: require exactly one-day lags; remove duplicate reciprocal links; estimate border-specific level offsets only on prior data; compare neighbor changes rather than levels; scale or demean within zones; combine multiple neighbors; and separate connected links by flow availability. A placebo could pair non-neighboring zones matched on average price and coverage. These are plausible new tests, not evidence contained here.
The result is therefore robust only in the narrow reproducibility sense: the frozen naive substitution rule loses decisively on its point estimate. It does not close the broader family of cross-zone forecast models.
Limitations
The neighbor challenger is intentionally simplistic. Electricity zones can have persistent price-level differences, so directly substituting B’s level for A’s level imposes an implicit zero-offset assumption. A model using neighbor innovations could behave differently.
The method can count the same local target once per neighbor and perhaps again under reciprocal link identity. This weights highly connected zones more heavily. Coverage is not balanced across borders. Adjacent common rows may have calendar gaps, turning the “previous day” label into previous observation.
All values are daily means. Native quarter-hour curves contain shape information that is unavailable to the benchmark. The test does not preserve a real auction issuance clock, split training and evaluation, or compare against production forecast lineage. It is not a model-promotion result.
The data are observational and networked. Common shocks can make local and neighbor prices move together, while congestion and structural differences separate their levels. Flow, capacity, load, generation, weather, outages, and calendar effects are absent from the predictor.
The error unit is wholesale EUR/MWh. It is not a household-cost difference and should not be multiplied by an assumed load without a registered tariff simulation. Taxes, network fees, supplier margin, metering, and consumer behavior are out of scope.
Practical implication
Do not use yesterday’s neighboring-zone price as a drop-in replacement for yesterday’s local price. Household applications should obtain the correct local bidding-zone series and validate any cross-zone feature against a local baseline on a clock-safe holdout.
The negative result does not forbid cross-zone modeling. It raises the bar: a challenger should account for offsets, use only information available at issuance, declare its neighbor set, and demonstrate matched out-of-sample improvement. Until such evidence exists, local persistence is the safer simple benchmark.
Reproducibility
Construct directed neighbor pairs from represented border links. For each pair, intersect dates with both daily price rows, sort the common dates, and for every row after the first compute two absolute errors against the current local mean: prior local mean and prior neighbor mean. Average each error list and subtract neighbor MAE from local MAE. The expected neighbor-error count is 352,670 and expected improvement is -193.64568264383135 EUR/MWh.
Document UTC-date identity, common-date intersections, duplicate links, missing gaps, and ordering. Enforcing exact next-day continuity, fitting offsets, using interval curves, or evaluating a trained model would produce a new study. Licensing appears at /legal/data-licensing and the canonical licensing document.
Disclosure
The analysis and text were model-assisted. This public working paper is not peer reviewed. The tested challenger is a naive benchmark and not a production model; no forecast is promoted. The paper makes no customer-savings claim. Volt has no live traders or live capital. This document is not trading advice, investment advice, or an instruction to forecast from neighboring prices.
References
- ENTSO-E — Single Day-ahead Coupling (SDAC)
- European Commission — EU electricity trading in the day-ahead markets becomes more dynamic
- International Energy Agency — Electricity 2026
- ACER and CEER — Rewarding flexibility: How retail contract choice can help unlock consumer flexibility
- Voltcast — Voltcast Architecture