Do cross-border flows make neighboring prices converge?
Do cross-border flows make neighboring prices converge. Positive values are consistent with convergence, but constraints and common shocks remain confounders.
Abstract
This working paper asks whether larger cross-border electricity flows are associated with closer day-ahead prices in neighboring European bidding zones. The preregistered analysis uses an observational daily panel assembled from directional border flows and bidding-zone mean prices. For every available directed border and date, it pairs the absolute daily mean flow with the absolute difference between the two zones’ daily mean prices. The reported statistic is the Pearson correlation between absolute flow and the negative of that absolute price spread, so a positive coefficient is consistent with tighter prices when flow is larger.
Across 61,988 matched border-link-days, the recorded coefficient is 0.049995731213349624. That is a weak positive association, not evidence that increasing a flow would itself cause prices to converge. Cross-border capacity, congestion, weather, generation availability, demand, common fuel conditions, market rules, and the coupled auction can determine both flow and price at the same time. Daily averaging also removes the within-day sequence needed to decide whether a flow preceded, followed, or merely coincided with a price difference.
The answer is therefore deliberately narrow: the public evidence is directionally consistent with convergence, but the magnitude is small and the design does not identify a causal market-coupling effect. The result is useful as a descriptive baseline for household-facing discussions of local bidding-zone prices. It is not a policy evaluation, a forecast promotion, a retail-bill estimate, or trading advice.
Plain-language answer
Neighboring electricity markets with more power moving across their border were, on average, only slightly more likely to have similar daily prices in this dataset. The relationship is weak. A correlation of 0.049995731213349624 is close to zero on the usual scale from negative one to positive one, although it points in the convergence-consistent direction defined in the protocol.
That does not mean flows “make” prices converge in a causal sense. The same conditions that open or constrain a border can affect both quantities. For example, a shared weather system may alter production and demand on both sides. A network constraint may limit exchange precisely when the price gap is large. The day-ahead coupling algorithm jointly considers bids, offers, and transmission constraints; observed schedules and prices are outcomes of that connected process, not two isolated variables.
For a household on a tariff linked to its local bidding-zone price, the practical message is modest. Cross-border exchange is part of the setting in which local prices are formed, but flow alone is not a reliable shortcut for predicting whether two zones will have the same price tomorrow. Local prices, native market intervals, and uncertainty remain necessary inputs.
Research question
The registered question is: Do cross-border flows make neighboring prices converge? The measurable version is more limited: among observed border-link-days, is a larger absolute daily mean flow associated with a smaller absolute difference in neighboring zones’ daily mean day-ahead prices?
The distinction between the title and the estimand matters. “Make” suggests an intervention and a causal effect. This study has neither a randomized intervention nor a quasi-experimental source of variation in available transfer capacity. It estimates a same-day association. The positive direction is defined as convergence by correlating absolute flow with the negative absolute spread. The study does not claim that the flow direction identifies a zone’s full import balance, that scheduled flow equals unconstrained physical capacity, or that the paired zones are otherwise comparable.
The household relevance is also conditional. Wholesale bidding-zone prices can matter for dynamic tariffs, but the study does not model taxes, supplier margins, network charges, metering rules, or contract protection. It asks about wholesale spatial price formation, not the final bill.
Data and provenance
The evidence file is the public aggregate at /research-data/home-papers/do-cross-border-flows-make-neighboring-prices-converge.json. Its status is measured, its publication cutoff is 2026-08-30T00:00:00Z, and it identifies a daily-price window from 2021-01-01 through 2026-08-29. The common corpus also records a detailed-interval window beginning 2025-10-01 and a long-history window beginning 2015-01-01, but this paper’s headline calculation is the daily border panel. Those broader windows should not be mistaken for the exact coverage of every matched link.
The source contracts listed for the family are border_flows, day_ahead_prices, outage_events, generation_mix, and zone_load. The calculation here directly uses daily border-flow aggregates and daily day-ahead-price aggregates. The other named contracts define the preregistered family’s permissible evidence boundary; they do not imply that every table entered this coefficient.
The snapshot was read in a SELECT-only transaction with a 180-second statement timeout. The evidence records snapshot SHA-256 f77e3ae328f93916e53b1bab7516e1d0ac740a0dbf424cd2b73c81fee2559318, analysis-code SHA-256 57c57de79cdab2b5b6d6c54c485cb5162598c5ba0b0bfe995da40d75e6c52ba9, protocol SHA-256 adb36bf6b447af9f96339249b8becaefc20422499cca1977242866347a97bd4b, registry SHA-256 7bcb91d7476d0a69fe9fa75a5c7782f8117e0153f82f9112b7e1d307d3943717, and source-registry SHA-256 07949550ac443ff673fda5c0209b99f137544f3ffecf6775f109bb9d09663bd6. These hashes bind the public aggregate to the frozen analysis, but they do not independently prove causal validity.
The external sources provide context rather than substitute observations. ENTSO-E describes Single Day-Ahead Coupling and its consideration of cross-border constraints. The European Commission describes the move to finer day-ahead market time units. The IEA provides wider grids-and-flexibility context, while the ACER–CEER report connects wholesale conditions to consumer flexibility and contract choice. Voltcast’s architecture document specifies the internal price, flow, timestamp, and native-resolution contracts. No numerical finding in this paper is imported from those contextual sources.
Method
The implementation first forms a map keyed by origin zone, destination zone, and UTC date, with the recorded daily mean flow in megawatts. For each key, it looks up daily mean prices for both endpoint zones. A row is retained only when both prices are available. Each retained row contains the directed link identity, date, signed flow, absolute price spread, and signed origin-minus-destination price difference.
For this paper, the flow variable is the absolute value of daily mean flow. The price variable is the negative absolute daily mean-price difference. Pearson’s correlation is then calculated over matched rows. Negating the spread means that a positive coefficient has an intuitive label: larger absolute flow is associated with a tighter spread. Without that sign convention, the same relationship would appear as a negative correlation with the absolute spread.
This transformation does not solve endogeneity. It also discards flow direction, treats each directed link-day as an observation, and uses daily means. Serial dependence within a border, common shocks across borders, unequal link histories, repeated zone participation, and changing network regimes can all make nominal row count a poor guide to independent information. The registered family says blocked day/week bootstrap intervals and within-family Holm control apply to inferential claims. The public result, however, is explicitly descriptive and makes no unadjusted significance claim.
The regenerated evidence reports bootstrap_95_interval: null and labels the interval method “not reported for this estimand.” No uncertainty interval is therefore claimed for the correlation. A future inferential analysis would need to resample the correlation itself while preserving temporal and network dependence.
Results
The matched sample contains 61,988 border-link-days. The Pearson correlation between absolute daily mean flow and tighter neighboring-zone daily mean-price spread is 0.049995731213349624. Rounded for reading, the association is about 0.050.
The evidence interpretation is: “Positive values are consistent with convergence, but constraints and common shocks remain confounders.” The sign is positive under the convergence convention, so the descriptive direction agrees with the idea that more exchange and closer prices can coexist. The magnitude is weak. The result does not establish how much a one-megawatt increase in flow changes a price spread, because correlation is unitless and the analysis does not estimate a slope. It also does not show that every border behaves similarly; a pooled coefficient can combine heterogeneous links and periods.
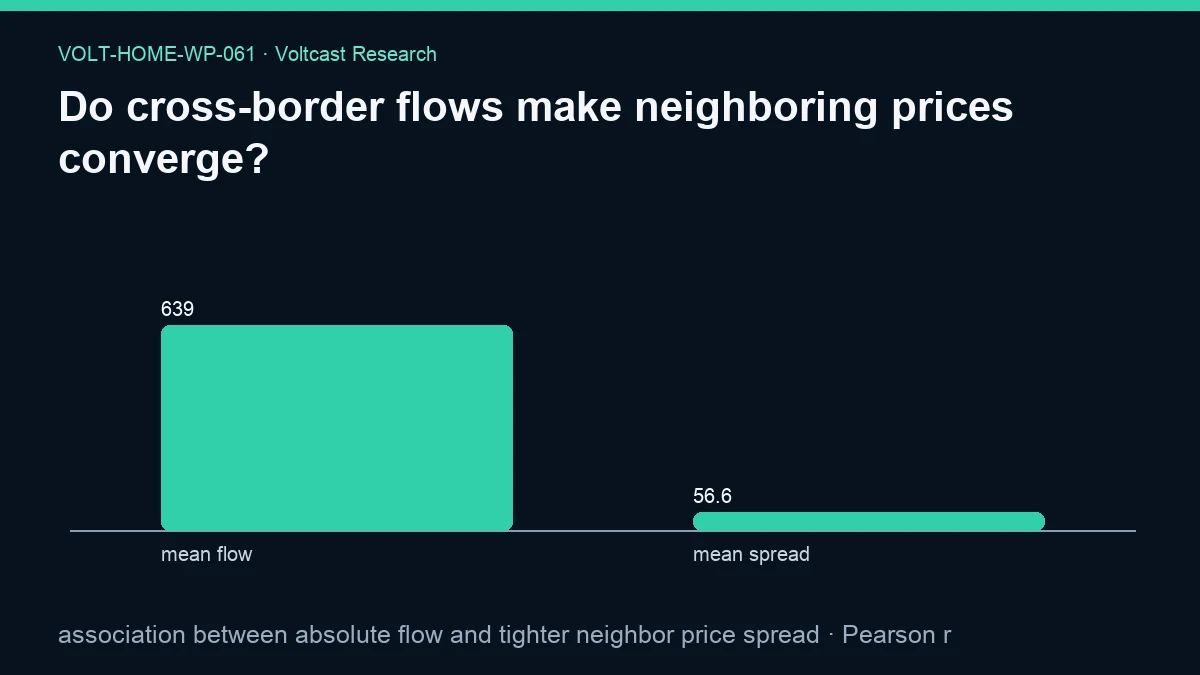
The regenerated figure uses the labels “mean flow” and “mean spread.” Its values are 638.5746002129445 and 56.62614426340582, rendered as 639 and 56.6. Those bars describe the inputs’ means; they are not the unitless 0.049995731213349624 correlation and should not be compared as if they shared a unit.
No secondary result is reported for this paper. In particular, the evidence does not provide border-specific coefficients, seasonal estimates, capacity-utilization bins, within-day lead-lag effects, or a retail-cost translation. Those quantities are therefore not inferred in the prose.
Robustness and placebo checks
The preregistered family names event studies, placebo windows, association-only network models, blocked uncertainty, and Holm control. For this specific headline artifact, the public JSON reports no paper-specific secondary or placebo estimate. The proper robustness conclusion is therefore about what remains unclaimed.
The evidence assumptions array is empty. That means no paper-specific assumptions were encoded in that field; it does not make the observational design assumption-free.
First, taking absolute flow avoids calling exports and imports inherently convergent or divergent, but it cannot distinguish free exchange from binding constraints. Second, the negative-spread sign convention makes interpretation transparent, yet it does not alter the underlying strength. Third, requiring both endpoint prices prevents unmatched price rows from entering the coefficient, but missingness may still vary by border and date. Fourth, daily aggregation reduces sensitivity to individual quarter-hours while simultaneously erasing the timing needed for a transmission claim.
A persuasive causal extension would need a prespecified source of plausibly external capacity variation, border and date controls, clustered or block-aware uncertainty, event-time diagnostics, and placebo dates or unaffected links. None is supplied in the current evidence. The measured coefficient should stand as the descriptive baseline, not be upgraded by reference to tests that were registered but not reported for this paper.
Limitations
This is an observational daily panel. It cannot identify a causal market-coupling effect. Flow and prices are jointly determined in a networked auction and power system. Available capacity, outages, renewable output, load, weather, fuel costs, neighboring conditions, and market design may confound the relationship.
The daily mean is a substantial compression. Opposing quarter-hour patterns can average to the same daily flow, and sharp price separation can be hidden by a daily mean price. A contemporaneous daily pair gives no propagation order. The study also uses observed directed link rows rather than a complete structural model of the European network. Multiple rows can share a zone and common shock, so 61,988 rows are not 61,988 independent experiments.
Coverage can differ by zone, link, and time. The data window does not guarantee balanced observations for every border. The analysis does not normalize flow by thermal capacity, available transfer capacity, demand, or generation. It does not separate uncongested from congested hours. It reports one pooled linear correlation, which can miss nonlinear or regime-specific relationships.
Finally, wholesale convergence is not synonymous with household bill convergence. Retail tariffs may damp, delay, cap, or add charges to wholesale prices. No customer data, measured household savings, or behavioral response enters this study.
Practical implication
The evidence supports using cross-border flow as context, not as a stand-alone household signal. A home-energy controller or analyst should continue to use the actual local bidding-zone curve and preserve its native intervals. Flow may help describe system conditions, but this weak pooled association is not a replacement for local prices or a validated forecast.
For public communication, the safe formulation is: larger observed daily flows were weakly associated with tighter neighboring-zone daily prices in the frozen panel. It is not safe to say that raising cross-border flows by a chosen amount will reduce household prices, or that a new interconnector will produce a particular convergence benefit, from this study alone.
Reproducibility
Reproduction begins with the frozen protocol, paper registry, public evidence JSON, and the analysis script bound by the disclosed hashes. Reconstruct directional flow-day keys, match both endpoint daily prices, calculate the absolute flow and absolute mean-price difference, negate the latter, and compute Pearson’s correlation on complete pairs. The expected public outputs are status measured, sample size 61,988, and coefficient 0.049995731213349624.
Reproducers should preserve UTC date semantics used by the flow map, verify endpoint-zone identity, avoid silently filling unmatched prices, and report whether duplicate reciprocal links are retained. Any altered aggregation, capacity normalization, link weighting, or date definition is a new analysis rather than an exact reproduction. The evidence and figure are licensed as disclosed at /legal/data-licensing and in the repository licensing document.
Disclosure
Analysis and drafting were model-assisted. This public working paper is not peer reviewed. It uses aggregate evidence frozen before publication, distinguishes contextual sources from measured results, and intentionally uses association language. Volt has no live traders or live capital; this paper concerns household-relevant electricity-market evidence and is not trading advice. It does not estimate retail bills or promise savings.
References
- ENTSO-E — Single Day-ahead Coupling (SDAC)
- European Commission — EU electricity trading in the day-ahead markets becomes more dynamic
- International Energy Agency — Electricity 2026
- ACER and CEER — Rewarding flexibility: How retail contract choice can help unlock consumer flexibility
- Voltcast — Voltcast Architecture