How persistent are household-relevant congestion price spreads?
How persistent are household-relevant congestion price spreads. Persistent high spreads are household-relevant when tariffs expose the local bidding-zone price.
Abstract
Large price differences between neighboring electricity bidding zones can matter to households whose dynamic tariff follows the local wholesale market. This paper examines the upper tail of observed neighboring-zone daily price spreads. It forms matched border-link-days from directional cross-border flow records and the mean day-ahead price in both endpoint zones, computes the absolute price difference, identifies the top tenth of those differences in the pooled panel, and reports the median within that selected tail.
The frozen evidence contains 6,199 selected border-link-days and a median top-decile spread of 59.701 EUR/MWh. This is a measure of the size of unusually wide daily neighboring-zone gaps. Despite the word “persistent” in the registered title, the statistic does not estimate how many consecutive days a gap lasts, a transition probability, or a duration distribution. It shows that the upper tail is economically material at the wholesale level, not that any particular border remains separated for a specified period.
The design is observational and daily. It does not isolate congestion as the cause of every spread, identify a causal effect of coupling, or translate wholesale differences into final household bills. The result is best read as a descriptive upper-tail benchmark and a reason to preserve local-zone identity in household energy tools. It is not a savings claim, a tariff recommendation, or trading advice.
Plain-language answer
When the analysis selects the largest tenth of daily price gaps observed between neighboring zones, the middle gap within that high-spread group is 59.701 EUR/MWh. In other words, wide daily differences are not just a theoretical possibility in the frozen panel.
However, this paper’s measured output does not tell us how long those gaps persist. It does not say that a 59.701 EUR/MWh gap commonly continues into the next day, nor does it count runs of consecutive high-spread days. The “top decile” is defined over pooled matched border-day observations, and the reported median describes their magnitude.
For households, the implication depends on the retail contract. A wholesale spread of a given size is not automatically a bill difference of the same size. Taxes, regulated network charges, supplier margins, hedging, caps, averaging, and meter settlement can change what reaches the customer. The evidence nevertheless shows why a controller should not substitute a neighboring country’s or zone’s price for the household’s actual local bidding-zone curve.
Research question
The broad question asks how persistent household-relevant congestion price spreads are. A complete answer would require at least two dimensions: how large the spreads become and how long they remain elevated. The available preregistered outcome measures the first dimension only. Its exact estimand is the median absolute daily mean-price difference among observations at or above the pooled 90th-percentile spread threshold.
“Congestion price spread” is a practical label for neighboring-zone separation, but the calculation does not classify every observation by a binding network constraint. Price differences can accompany limited transfer capacity, yet they can also reflect differences in bids, generation, demand, losses, market boundaries, or data coverage. Accordingly, the paper treats the measured values as neighboring-zone spreads and does not assign a congestion cause to each row.
Household relevance is similarly bounded. Dynamic retail exposure makes local wholesale variation potentially relevant, as discussed in the ACER–CEER context source, but no household account, tariff, or consumption profile is included. The study measures a wholesale market condition that a retail design may transmit, not a realized consumer outcome.
Data and provenance
The aggregate evidence is published at /research-data/home-papers/how-persistent-are-household-relevant-congestion-price-spreads.json. It records status measured, a publication cutoff of 2026-08-30T00:00:00Z, and a daily-price window from 2021-01-01 to 2026-08-29. The corpus metadata also names a detailed-interval window from 2025-10-01 and long history from 2015-01-01. The headline result remains a daily panel and should not be described as an interval-level estimate.
Permitted source contracts for the registered family are border_flows, day_ahead_prices, outage_events, generation_mix, and zone_load. This statistic is constructed from flow-link identities and endpoint daily prices. Naming the entire contract set preserves the protocol boundary; it does not mean outage, generation, and load variables were adjustment covariates in this particular calculation.
The extraction and analysis were read-only. Provenance identifies a 180-second statement timeout and snapshot SHA-256 7e97489fc8528c8cc8c38830e05b48d949ce1f67b98575dff26f5d7c321e4c67. The associated hashes are 57c57de79cdab2b5b6d6c54c485cb5162598c5ba0b0bfe995da40d75e6c52ba9 for analysis code, adb36bf6b447af9f96339249b8becaefc20422499cca1977242866347a97bd4b for the protocol, 7bcb91d7476d0a69fe9fa75a5c7782f8117e0153f82f9112b7e1d307d3943717 for the paper registry, and 07949550ac443ff673fda5c0209b99f137544f3ffecf6775f109bb9d09663bd6 for the source registry.
Five registered sources frame interpretation. ENTSO-E explains the coupled day-ahead market and cross-border constraints. The European Commission documents the move to 15-minute day-ahead trading. The IEA provides system-level grids and flexibility context. ACER and CEER discuss how contract choice can expose or protect consumers from wholesale conditions. Voltcast’s architecture documents native-resolution prices and the internal data contract. The numerical result comes from the frozen public evidence, not from extracting a new statistic from those references.
Method
The common grid-family routine begins with daily flow records keyed by origin zone, destination zone, and UTC date. It looks up the daily mean day-ahead price for each endpoint and retains complete pairs. For each pair it calculates the absolute difference between endpoint mean prices. Flow values establish the observed border-link panel but are not used to rank this paper’s spreads.
The procedure pools all matched absolute spreads and calculates their 90th-percentile threshold. It retains every row whose spread is at or above that threshold. The primary value is the median of the retained values. Selection at the threshold yields 6,199 observations in the evidence artifact.
This is a tail-summary design. It deliberately answers “how large is the middle of the widest group?” It does not create sequences by link, require adjacent dates, or measure survival above the threshold. The term “persistent” must therefore not be operationalized after seeing the result. Doing so would be a new analysis requiring its own frozen definitions for continuity, missing dates, border weighting, and threshold stability.
The regenerated evidence reports no bootstrap interval and names the interval method “not reported for this estimand.” The paper therefore makes no interval claim for the median. A future median interval would need to resample the median itself and preserve temporal and cross-link dependence rather than treating every pooled row as independent.
Results
The top-tail selection contains 6,199 matched border-link-days. Their median absolute neighboring-zone daily mean-price spread is 59.70099999999999 EUR/MWh, reported as 59.701 EUR/MWh.
The result establishes magnitude within the selected tail. Half of the selected observations are below that median and half above it, subject to the usual handling of ties. It does not mean that the median spread across all border-link-days is 59.701 EUR/MWh. It also does not mean ten percent of calendar days for every border have a gap at least this large; the threshold and count are pooled across available links and dates.
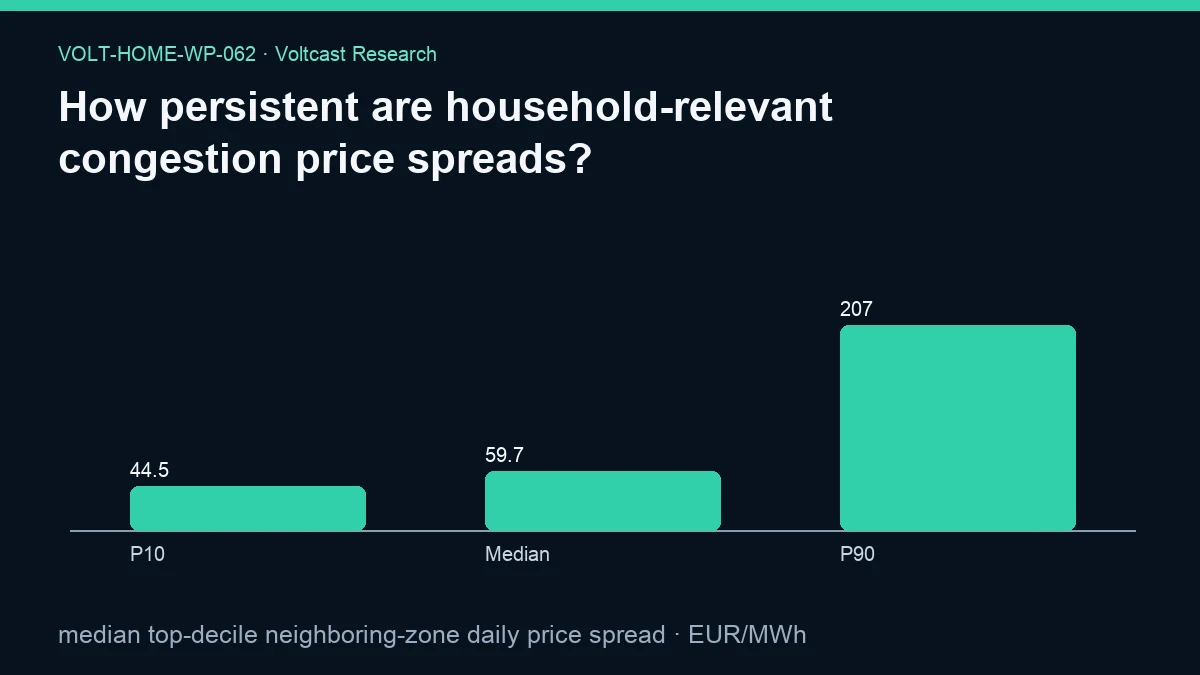
The figure reports the selected distribution with labels “P10,” “Median,” and “P90.” Their evidence values are 44.51258, 59.70099999999999, and 206.9733 EUR/MWh, rendered as 44.5, 59.7, and 207. These are quantiles within the selected top-decile sample, not persistence durations.
No secondary results are present. The public evidence does not report the threshold value itself, border-level tail medians, the fraction of household load exposed, consecutive-run lengths, seasonal splits, or pre/post comparisons. Those absent quantities are not reconstructed from the chart or contextual sources.
Robustness and placebo checks
The family protocol requires association language and anticipates placebo windows, blocked bootstrap reasoning, and within-family Holm control for inferential claims. This paper’s published result is descriptive and makes no significance claim. Its JSON provides no paper-specific placebo series.
Several design checks can still be stated. Absolute differences make the measure symmetric with respect to which endpoint is labeled origin. Matching both endpoint prices avoids calculating a spread with a missing side. Selecting by a pooled quantile prevents an arbitrary EUR/MWh cutoff from being chosen after inspecting individual borders. Reporting a median reduces the leverage of the most extreme values inside the already extreme subset.
Those choices do not establish temporal robustness. A persistence analysis would need to group by stable border identity, sort truly consecutive dates, define treatment of missing days, and estimate run lengths or transition probabilities. Placebo thresholds outside the upper tail, calendar-matched comparisons, and link-blocked resampling could test whether the conclusion is peculiar to pooling or crisis periods. None of those outputs appears in the frozen evidence. The honest robustness verdict is therefore that the magnitude is reproducible under the stated computation, while duration and causal explanations remain untested here.
Limitations
The main limitation is estimand-title mismatch. The reported statistic concerns top-tail magnitude, not persistence over time. Readers should not infer a duration from the sample count or median.
The analysis uses daily mean prices. A border can experience substantial quarter-hour separation that averages away, or brief extreme values that dominate a daily mean. Conversely, a large daily mean gap can arise from different intra-day shapes. The panel starts from available directional flow-link records, so it may not represent every physical or market border on every date. Reciprocal records and repeated zones can create dependence.
The top-decile threshold is pooled. Links with longer histories or more complete records contribute more rows. Structural differences among borders, currencies before normalization, market regimes, demand scale, and generation portfolios are not modeled in the headline summary. The method does not control for outages, load, weather, capacity, or common shocks even though some are within the family’s allowed data boundary.
Calling the gap “congestion” is interpretive rather than a row-level diagnosis. No available-transfer-capacity or binding-constraint flag is used. The study is observational and does not identify a causal coupling effect.
Finally, EUR/MWh is a wholesale energy unit. A household’s bill includes consumption quantity and retail terms. This paper neither applies a load profile nor includes taxes, fees, supplier margin, network charges, or risk protection. It does not measure customer savings or losses.
Practical implication
Home-energy software should preserve the user’s bidding-zone identity and fetch the corresponding local curve. The observed upper tail is large enough that silently substituting a neighboring-zone price can materially misstate the wholesale signal. The safe response is better data lineage, not a promise that every customer can monetize the gap.
For tariff comparisons, analysts should distinguish the wholesale component from the final bill and state whether contracts pass through native intervals. For grid research, the next useful study would measure spell length by border with prespecified continuity rules. Until that exists, this result supports a claim about upper-tail size only.
Reproducibility
An exact reproduction uses the frozen snapshot and analysis code identified above. Build the (from_code, to_code, utc_date) flow map, join each key to both endpoint daily mean prices, compute the absolute endpoint difference, calculate the pooled 0.9 quantile, select values at or above it, and take their median. The expected outputs are 6,199 selected observations and 59.70099999999999 EUR/MWh.
Record UTC-date semantics, endpoint identity, missing-price exclusions, quantile interpolation, and treatment of ties. A reproduction should not substitute interval prices, household tariffs, maximum daily spreads, or border-balanced weights while claiming identity with this artifact. It should preserve the current null interval rather than invent uncertainty for the median. Evidence and figure licensing are disclosed at /legal/data-licensing and in the canonical licensing document.
Disclosure
This working paper was model-assisted. It is not peer reviewed. It reports a preregistered aggregate faithfully, including the fact that measured magnitude does not answer temporal persistence. No customer data or restricted market evidence was used. Volt has no live traders or live capital. This is public household-energy research, not trading advice, financial advice, or a guarantee of retail savings.
References
- ENTSO-E — Single Day-ahead Coupling (SDAC)
- European Commission — EU electricity trading in the day-ahead markets becomes more dynamic
- International Energy Agency — Electricity 2026
- ACER and CEER — Rewarding flexibility: How retail contract choice can help unlock consumer flexibility
- Voltcast — Voltcast Architecture