Can synchronized preheating create a household rebound peak?
Can synchronized preheating create a household rebound peak. A five-percent synchronized shift is a stress scenario, not an observed Home Assistant fleet event.
Can synchronized preheating create a household rebound peak?
Abstract
Price-based automation can diversify load across low-price intervals, but identical controllers can also synchronize. This working paper quantifies a deliberately simple stress case in which 5% of recorded mean zone load is shifted into the same preheating period. Across 47,213 positive load observations, the recorded mean-load scale is 7,770.674172833754 MW. Five percent equals an illustrative rebound of 388.5337086416877 MW, raising the displayed aggregate scale to 8,159.207881475441 MW. No uncertainty interval is reported for this estimand. This is not an observed event, penetration estimate, or forecast of Home Assistant users. The 5% factor is an explicit stress assumption; the resulting rebound is mechanically proportional to it. The result shows why controller diversity, power limits, and network-aware signals deserve attention, but it does not establish that price-aware heating caused a historical peak. The reduced-order synthetic scenarios are not building simulations, customer telemetry, savings claims, or retail bills.
Plain-language answer
Yes, synchronized preheating can create an aggregate peak in the declared stress scenario. If load equal to 5% of the recorded mean zone-load scale arrives together, the added load is 388.53 MW. The baseline scale is 7,770.67 MW, so the illustrated total becomes 8,159.21 MW.
The word “can” is important. No fleet event was observed. The analysis does not know how many heat pumps, homes, or automation systems were operating, and it does not claim that 5% synchronization is likely. It asks what the arithmetic consequence would be if that share synchronized. The Energy and Buildings study is assigned context because tariff-driven shifting may need measures that avoid preheating surges. ACER and CEER provide assigned context for scaling consumer flexibility. Voltcast’s 388.53 MW remains a stress value, not a measured behavioural finding.
Research question
The registered question asks whether synchronized preheating can create a household rebound peak. We operationalise synchronization as an added load equal to 5% of the mean of all positive recorded zone-load observations in the frozen evidence snapshot.
This is an aggregate stress calculation. It does not model how price-aware households select intervals, whether they were previously off, how long preheating lasts, or whether load is genuinely shifted rather than added. “Household rebound” describes the hypothetical source of synchronization, not the identity of the observed load records. The registered method family includes rebound sensitivities, and the paper’s trading-claims field is “none.”
Data and provenance
The evidence cutoff is 2026-08-30T00:00:00Z. The declared data windows are 2021-01-01 to 2026-08-29 for daily prices, 2025-10-01 to 2026-08-29 for detailed intervals, and 2015-01-01 to 2026-08-29 for long history. The family source-table contract includes day_ahead_prices, zone_temp_weighted, zone_load, generation_mix, and forecasts.
This paper’s calculation uses 47,213 positive values from zone_load. Their mean is 7,770.674172833754 MW. The evidence does not label those observations as household, heat-pump, or synchronized load. Price, temperature, generation, and forecasts define the broader registered family, but they do not determine the 5% factor in this stress calculation.
The analysis ran in a read-only transaction with a 180-second statement timeout. The frozen snapshot SHA-256 is f77e3ae328f93916e53b1bab7516e1d0ac740a0dbf424cd2b73c81fee2559318; analysis-code SHA-256 is 57c57de79cdab2b5b6d6c54c485cb5162598c5ba0b0bfe995da40d75e6c52ba9; protocol SHA-256 is adb36bf6b447af9f96339249b8becaefc20422499cca1977242866347a97bd4b; registry SHA-256 is 7bcb91d7476d0a69fe9fa75a5c7782f8117e0153f82f9112b7e1d307d3943717; and source-registry SHA-256 is 07949550ac443ff673fda5c0209b99f137544f3ffecf6775f109bb9d09663bd6. The evidence and figure hashes are 02c019be4f4de325363d54a5e79356390d2785f3d75005b4597f000164005284 and b5b7f886820145ba2294cc83d4dae3d3e24485e5cd50ccc4d66c3dc6c99422ee. The source registry was accessed on 2026-08-30.
The assigned European Commission communication concerns retail prices and flexibility. The dynamic-tariff viability study supplies context for automated household flexibility and enabling systems. The Nordic cost–comfort study supplies context for multi-objective household scheduling. No external penetration estimate or rebound statistic is used.
Method
The analysis selects every recorded zone-load value greater than zero. It calculates their arithmetic mean, (L). The synchronization share (s) is fixed at 0.05. The illustrative rebound is (sL), and the displayed post-rebound scale is (L+sL).
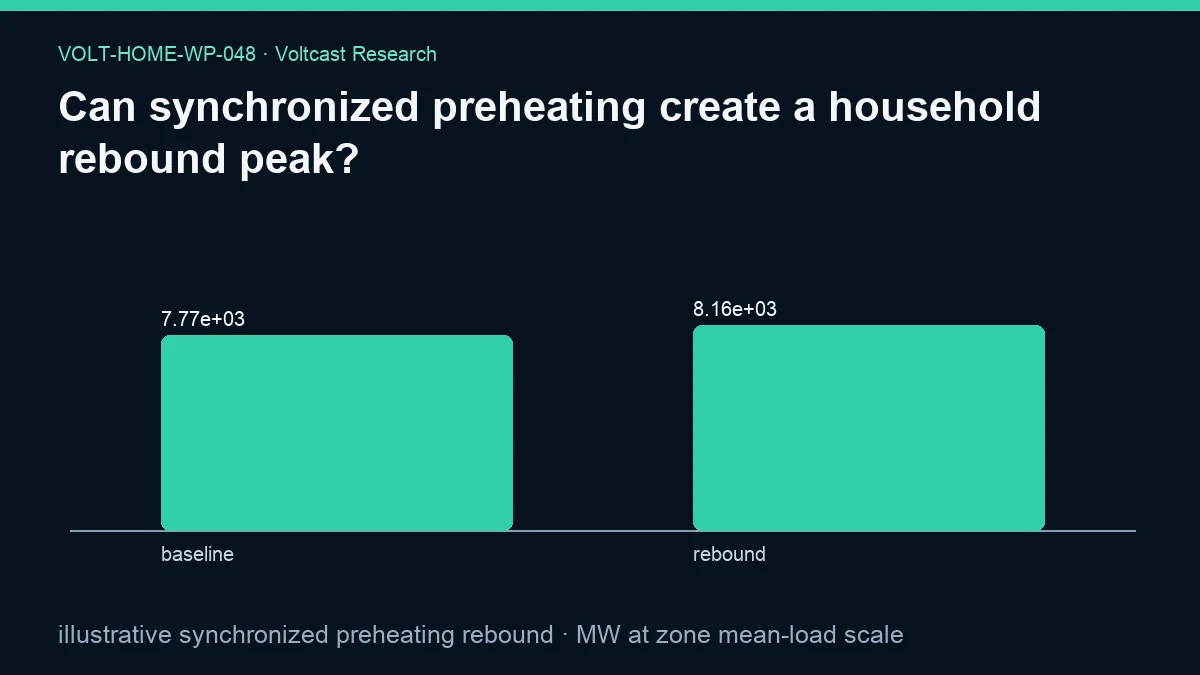
Substituting the evidence values yields (L=7,770.674172833754) MW and (sL=388.5337086416877) MW. The total shown by the baseline-plus-rebound comparison is 8,159.207881475441 MW. The 5% assumption is preserved exactly from the evidence: “5% of recorded mean zone load synchronizes.”
The registered assumptions are “Synthetic heat demand; no customer telemetry,” “COP sensitivity declared per paper,” “wholesale energy only,” and “5% of recorded mean zone load synchronizes.” COP does not enter the stress formula. There is no building count, heat-pump capacity, diversity factor, feeder topology, ramp duration, or energy-conservation constraint.
The regenerated evidence reports no uncertainty interval for the underlying positive load values or the rebound and names the interval method as “not reported for this estimand.” Within-family Holm control applies to inferential claims. This stress test makes no unadjusted significance claim and estimates no event probability.
Results
The primary result is an illustrative synchronized preheating rebound of 388.5337086416877 MW at zone mean-load scale. It is based on 47,213 positive load observations. The underlying recorded mean load is 7,770.674172833754 MW, and adding the stress increment gives 8,159.207881475441 MW. The machine-readable figure labels are baseline and rebound, with those latter two values respectively.
The evidence’s registered interpretation is: “A five-percent synchronized shift is a stress scenario, not an observed Home Assistant fleet event.” That condition applies to both the increment and the displayed total.
The evidence reports no interval for the underlying mean-load input. The headline rebound is exactly 5% of the point estimate. It is therefore not independent evidence of an observed peak and carries no precision claim.
The stress magnitude is large enough to be operationally noticeable at an aggregate zone scale, but the result cannot locate the load on a distribution network or determine whether local constraints would bind. It also cannot tell whether preheating merely moves 388.53 MW from a later interval, adds net energy through losses, or reduces a later peak. The defensible finding is conditional: if 5% of this mean-load scale synchronizes, the instantaneous increment is 388.53 MW.
Robustness and placebo checks
The zero-synchronization baseline is the primary implementation placebo. At a 0% share, the added rebound is zero and the displayed value remains the mean load. At 5%, the increment is exactly proportional. This confirms the arithmetic but does not validate the share.
No bootstrap interval is reported for the underlying load scale or behavioural uncertainty about synchronization. No alternative 1%, 2%, or 10% grid is included in the frozen evidence, and this paper does not invent one as a measured result. Readers can understand linear scaling, but a different percentage would be a new declared scenario.
There is no historical event-study placebo, randomized controller population, feeder-level comparison, or before-and-after household fleet. No check distinguishes coincident preheating from ordinary load growth or weather-driven demand. Within-family Holm governance is retained, while the paper makes no p-value, causality, or likelihood claim.
Limitations
The 5% synchronization factor is not measured. It is not a forecast of smart-home adoption, heat-pump penetration, or response rate. A realistic rebound depends on device diversity, thermal state, setpoints, weather, price-curve shape, controller algorithms, communications, and local network constraints.
The load observations are aggregate zone values. Scaling their mean cannot reveal feeder, transformer, or household peaks. A 388.53 MW zone-level increment could be geographically dispersed or locally concentrated; the network consequences differ sharply.
The registered limitation is that daily temperature and price summaries cannot reproduce a building-specific thermal state. The calculation also does not conserve shifted energy across intervals. It has no preceding load reduction or later payback, so “rebound” is an illustrative instantaneous increment rather than a full load-shape simulation. It omits COP, losses, comfort, and power limits.
The reduced-order synthetic scenarios are not building simulations, customer telemetry, savings claims, or retail bills. The result is not evidence about Home Assistant, any other integration, or actual customer actions. It is not a capacity requirement, grid forecast, or statement that dynamic tariffs necessarily raise peaks.
Practical implication
Controller designers should avoid deterministic “everyone starts at the single cheapest timestamp” behaviour. Safe approaches can spread start times, rotate among nearly equivalent intervals, respect device power limits, and incorporate network or capacity signals where available. Randomization should remain bounded by comfort and service deadlines.
System operators and retailers should also measure aggregate response before assuming diversity. The assigned policy sources frame consumer flexibility as potentially valuable, but scaling it safely requires tariff designs and automation that do not simply move all demand to the same new peak.
Reproducibility
The canonical evidence file is /research-data/home-papers/can-synchronized-preheating-create-a-household-rebound-peak.json; the figure is /research-media/home-papers/can-synchronized-preheating-create-a-household-rebound-peak.webp. The JSON freezes the 5% assumption, sample size, primary value, explicit null interval, source tables, coverage windows, interpretation, limitations, and provenance hashes.
To reproduce the primary value, select positive recorded zone-load values from the frozen snapshot, take their arithmetic mean over 47,213 observations, and multiply by 0.05. Add that increment to the mean for the figure’s rebound bar. Preserve the publication cutoff and hashes. An analysis using a different synchronization share, interval duration, zone, or feeder is a new scenario.
Data licensing and attribution requirements are documented at /legal/data-licensing and Voltcast data licensing and redistribution. Reuse must preserve the statement that this is not an observed Home Assistant fleet event.
Disclosure
Analysis and drafting were model-assisted; sources, code, assumptions, and evidence hashes are disclosed. This public working paper is not peer reviewed. It is not trading advice and contains no trading claim. Volt has no live traders or live capital. The paper does not predict grid adequacy or authorize control of customer devices.
References
energy-buildings-heat-pump— Energy and Buildings. Assessment of the thermal energy flexibility of residential buildings with heat pumps under various electric tariff designs. Kind: peer-reviewed; source registry accessed 2026-08-30.nordic-cost-comfort— Energies. Exploring Cost–Comfort Trade-Off in Implicit Demand Response for Fully Electric Solar-Powered Nordic Households. Kind: peer-reviewed; source registry accessed 2026-08-30.acer-retail-2025— ACER and CEER. Rewarding flexibility: How retail contract choice can help unlock consumer flexibility. Kind: official; source registry accessed 2026-08-30.ec-retail-flexibility-2026— European Commission. Communication from the Commission on the Citizens Energy Package. Kind: official; source registry accessed 2026-08-30.dynamic-tariff-viability— Advances in Applied Energy. Assessing the conditions for economic viability of dynamic electricity retail tariffs for households. Kind: peer-reviewed; source registry accessed 2026-08-30.