How many hours of thermal inertia does price-aware heating need?
How many hours of thermal inertia does price-aware heating need. This is the observed price-range opportunity scaled by a two-hour inertia assumption.
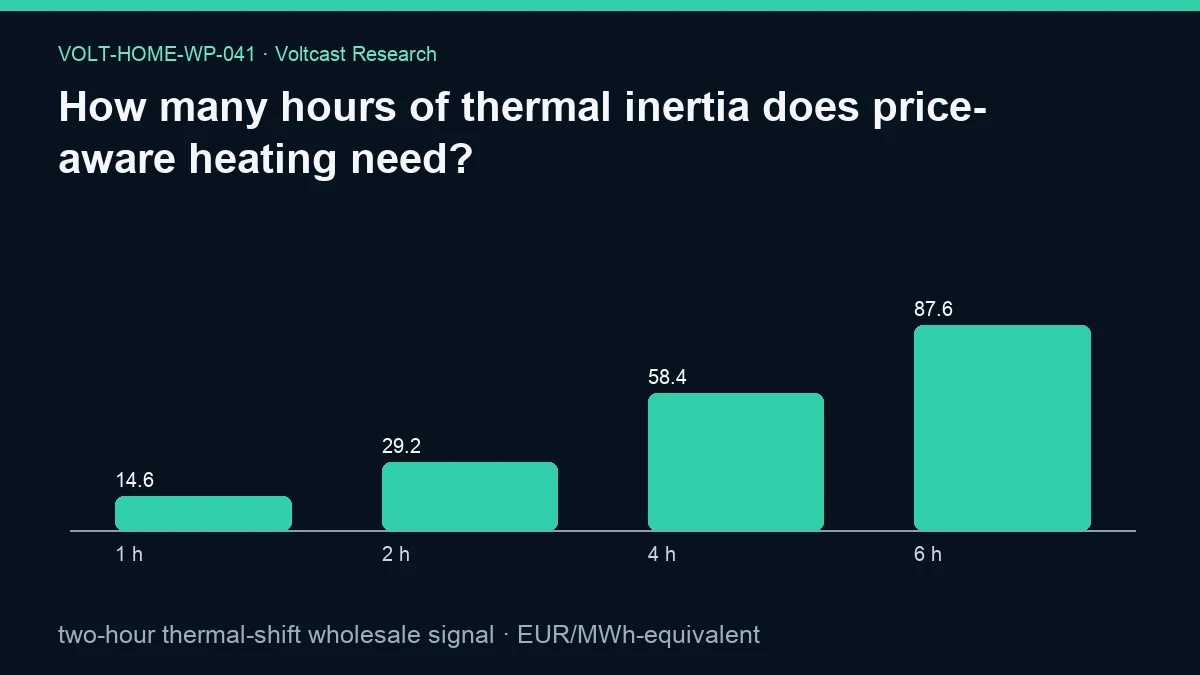
How many hours of thermal inertia does price-aware heating need?
Abstract
This working paper asks how the declared duration of thermal shifting changes the wholesale price opportunity available to price-aware electric heating. The frozen evidence pairs daily temperature coverage with day-ahead price summaries and applies a deliberately simple scaling rule to 2,367 matched observations. Under a declared assumption of two hours of lossless thermal shifting, the measured signal is 29.209714 EUR/MWh-equivalent. No uncertainty interval is reported for this estimand. The accompanying one-, two-, four-, and six-hour sensitivity values are 14.604857, 29.209714, 58.419428, and 87.629142 EUR/MWh-equivalent. These are opportunity signals, not energy savings or a claim that any building can move heat for those durations. The result does not identify a universal minimum number of hours. It shows how a fixed market-price range scales when a shift horizon is declared. The reduced-order synthetic scenarios are not building simulations, customer telemetry, savings claims, or retail bills.
Plain-language answer
There is no defensible single answer such as “a home needs four hours.” In this evidence, each additional declared hour exposes another twenty-fourth of the observed mean daily price range. Two hours produces a mean signal of 29.21 EUR/MWh-equivalent. One hour produces 14.60; four hours produces 58.42; and six hours produces 87.63. The relationship is linear because the method makes it linear, not because real buildings behave that way.
For a household, the practical threshold is therefore building-specific. A controller needs enough usable thermal storage to bridge a cheaper interval and a more expensive interval without violating room-temperature, hot-water, equipment-power, or recovery constraints. The Energy and Buildings study provides the relevant context that thermal flexibility depends on the building and tariff design. The Nordic cost–comfort study reinforces that comfort is an objective rather than a free by-product. This paper measures the price-side opportunity only.
Research question
The registered question is: how many hours of thermal inertia does price-aware heating need? We operationalise it narrowly: how does a one-to-six-hour declared shift horizon scale an observed daily day-ahead price range, and what is the two-hour reference value?
That operational question is intentionally smaller than a building-engineering question. It does not estimate a resistance–capacitance model, fabric heat loss, emitter temperature, compressor cycling, occupancy, or a household’s preferred comfort band. It asks whether a modest horizon is enough to expose a non-zero market signal before those building-specific constraints are considered. The registered method family is “transparent reduced-order thermal scenarios with comfort, COP, rebound, and forecast sensitivities.” This paper uses the thermal-horizon part of that family and makes no trading claim.
Data and provenance
The public evidence was frozen with publication cutoff 2026-08-30T00:00:00Z. It records daily-price coverage from 2021-01-01 through 2026-08-29, detailed intervals from 2025-10-01 through 2026-08-29, and long-history coverage from 2015-01-01 through 2026-08-29. The registered source-table contract contains day_ahead_prices, zone_temp_weighted, zone_load, generation_mix, and forecasts. For this calculation, the operative panel is the set of daily price summaries that can be paired to a non-null population-weighted zone temperature. The other registered tables remain part of the family-level evidence contract but do not add a hidden physical building model to this result.
The primary sample contains 2,367 matched zone-days. The analysis was executed in a SELECT-only transaction with a 180-second statement timeout. The public evidence records snapshot SHA-256 7e97489fc8528c8cc8c38830e05b48d949ce1f67b98575dff26f5d7c321e4c67, analysis-code SHA-256 57c57de79cdab2b5b6d6c54c485cb5162598c5ba0b0bfe995da40d75e6c52ba9, protocol SHA-256 adb36bf6b447af9f96339249b8becaefc20422499cca1977242866347a97bd4b, registry SHA-256 7bcb91d7476d0a69fe9fa75a5c7782f8117e0153f82f9112b7e1d307d3943717, and source-registry SHA-256 07949550ac443ff673fda5c0209b99f137544f3ffecf6775f109bb9d09663bd6. The evidence and figure hashes in the manifest are 05828340e7887a936ad3ca42b94105cf7c1278214b17dc62c546fbebd8908501 and b41254bf0f3f303d9833a0f22f35033c878bf8fb346569f0a65d75206b62db2d.
The sources assigned in the paper registry provide context for tariff design, consumer flexibility, comfort, and economic viability. ACER and CEER discuss why contract choice matters for consumer flexibility. The European Commission communication supplies the registered policy context for retail prices and flexibility. Neither source is treated as evidence that the synthetic two-hour scenario describes a particular customer.
Method
For each matched zone-day, the analysis takes the recorded maximum day-ahead price minus the recorded minimum day-ahead price. Call that daily range (R), measured in EUR/MWh. A declared shift horizon (h) is converted into a reduced-order signal as (R \times h / 24). The primary outcome fixes (h=2). The figure repeats the same calculation for (h=1,2,4,6).
This formula should be read literally. It assumes two hours of lossless thermal shifting for the primary result. It does not calculate the heat energy stored in walls, floors, water, or air. It does not apply a coefficient of performance to convert delivered heat into electricity. COP sensitivity is declared at the cluster level and examined separately in VOLT-HOME-WP-042; no COP value is smuggled into this paper. It also assumes wholesale energy only. Taxes, supplier margins, value-added tax, metering charges, network charges, heat-pump losses, and retail tariff mark-ups are outside the calculation.
The mean of the 2,367 transformed observations is the reported primary value. The regenerated evidence sets bootstrap_95_interval to null and describes the interval method as “not reported for this estimand.” The calculation is descriptive. Within-family Holm control applies to inferential claims, but this paper makes no unadjusted significance claim and does not turn the point estimate into a test of household profitability.
Results
The mean two-hour thermal-shift wholesale signal is 29.20971412477116 EUR/MWh-equivalent. Rounded for reading, that is 29.21 EUR/MWh-equivalent. No uncertainty interval is reported for this estimand. The sample size is 2,367 matched observations.
The declared horizon grid is:
- one hour: 14.604857 EUR/MWh-equivalent;
- two hours: 29.209714 EUR/MWh-equivalent;
- four hours: 58.419428 EUR/MWh-equivalent;
- six hours: 87.629142 EUR/MWh-equivalent.
The implied mean daily price range underlying those values is 350.516569 EUR/MWh. The grid is therefore a transparent rescaling of the same range, not four independently estimated responses. Doubling the horizon doubles the signal by construction. The measured result supports the limited conclusion that even a two-hour declared horizon exposes a non-zero wholesale range in this sample. It does not support a claim that two hours is physically sufficient, optimal, comfortable, or financially worthwhile in a real home.
Robustness and placebo checks
The main robustness check is the predeclared horizon sensitivity. It shows that the headline is not tied to a hidden optimizer or a selected single duration: readers can see the one-, two-, four-, and six-hour outputs generated by the same rule. The evidence does not report a bootstrap interval, so uncertainty across observed days is not quantified here and the 2,367 rows must not be treated as independent proof of precision.
There is no causal placebo in this descriptive paper. A shuffled-price placebo would answer a different question because the method uses within-day extrema and contains no timing model to disrupt. There is likewise no comparison against a thermostatic baseline, an uncontrolled heat pump, or a full building simulation. Calling any of those checks “passed” would invent evidence.
The strongest conceptual placebo is the zero-hour case implied by the formula: at (h=0), the signal is zero. That arithmetic identity confirms the scaling implementation but is not empirical validation. The horizon grid confirms monotonic mechanical scaling, while sampling variability remains unquantified because the evidence reports no interval. The dynamic-tariff viability study is used only to situate why enabling costs and tariff conditions matter; its findings are not imported as a validation of Voltcast’s synthetic value.
Limitations
Daily temperature and price summaries cannot reproduce a building-specific thermal state. The analysis does not know floor area, insulation, thermal mass, heating curve, emitter type, heat-pump capacity, defrost behaviour, hot-water tank, occupancy, solar gains, ventilation, or starting indoor temperature. A two-hour lossless shift is an assumption, not a measurement.
The daily maximum-to-minimum price range is an opportunity envelope. A device may be unable to move load between those exact intervals because heat demand, compressor limits, minimum run times, and comfort constraints intervene. The result also omits COP. A cheaper electrical interval can still be unattractive per unit of delivered heat if outdoor conditions lower efficiency; that issue belongs to the next paper.
The sample spans multiple zones and dates. Its mean is not a local tariff quote. Wholesale energy is only one component of what a household pays, and the preferred interval can change after network time-of-use charges, taxes, supplier terms, and fixed charges are included. The reduced-order synthetic scenarios are not building simulations, customer telemetry, savings claims, or retail bills. No result should be annualised into household savings without an explicit heat-load profile and a complete retail tariff.
Practical implication
Use the result as a screening scale, not a thermostat setting. A home-energy controller should first estimate a safe, building-specific shift envelope from observed indoor-temperature response and device constraints. It can then compare that envelope with the published price curve. If only one or two hours are safely available, the evidence suggests there can still be a wholesale signal; if more hours are available, the theoretical envelope grows, but comfort and efficiency must be checked before acting.
Contract choice also matters. ACER and CEER’s registered report and the European Commission’s registered policy report frame flexibility as dependent on the retail arrangement, not merely the wholesale curve. A controller should expose the assumed tariff components and allow the occupant’s comfort limits to override price optimisation.
Reproducibility
The canonical public input is /research-data/home-papers/how-many-hours-of-thermal-inertia-does-price-aware-heating-need.json. It contains the paper ID, title, slug, status, assumptions, data windows, sample size, primary value, explicit null interval, interpretation, limitations, source tables, figure contract, and provenance hashes. The matching frozen figure is /research-media/home-papers/how-many-hours-of-thermal-inertia-does-price-aware-heating-need.webp.
To reproduce the statistic from the frozen snapshot, join daily price summaries to non-null population-weighted zone temperatures on zone and day. Compute max_price - min_price for each of the 2,367 matched rows, multiply each range by 2 / 24, and take the arithmetic mean. For the sensitivity figure, repeat with 1 / 24, 4 / 24, and 6 / 24. Do not reconstruct or report an interval that is null in the regenerated evidence. Preserve the publication cutoff and hashes; using later observations would create a new result rather than reproduce this one.
The licensing note in the evidence points readers to /legal/data-licensing and Voltcast data licensing and redistribution. Reproduction must retain source attribution and must not infer customer behaviour from aggregate public-safe data.
Disclosure
Analysis and drafting were model-assisted; sources, code, assumptions, and evidence hashes are disclosed. This working paper is not peer reviewed. It reports a synthetic, reduced-order wholesale scenario and no trading claims. Volt has no live traders or live capital, and this paper is not trading advice. It is also not engineering advice for configuring a heat pump or overriding manufacturer, installer, safety, hygiene, or comfort controls.
References
- Energy and Buildings. “Assessment of the thermal energy flexibility of residential buildings with heat pumps under various electric tariff designs.” https://doi.org/10.1016/j.enbuild.2023.113257
- Energies. “Exploring Cost–Comfort Trade-Off in Implicit Demand Response for Fully Electric Solar-Powered Nordic Households.” https://doi.org/10.3390/en18215568
- ACER and CEER. “Rewarding flexibility: How retail contract choice can help unlock consumer flexibility.” https://www.ceer.eu/wp-content/uploads/2025/11/ACER-CEER-2025-Retail-monitoring.pdf
- European Commission. “Communication from the Commission on the Citizens Energy Package.” https://eur-lex.europa.eu/legal-content/EN/TXT/?uri=CELEX%3A52026DC0115
- Advances in Applied Energy. “Assessing the conditions for economic viability of dynamic electricity retail tariffs for households.” https://doi.org/10.1016/j.adapen.2024.100174