Did 15-minute trading create volatility—or reveal it?
Did 15-minute trading create volatility—or reveal it. The statistic decomposes observed variance; it does not identify a causal effect of the market redesign.
Did 15-minute trading create volatility—or reveal it?
Abstract
Quarter-hour prices expose variation that an hourly series necessarily compresses. This paper decomposes observed quarter-hour price variance and asks what share lies within the hour. Across 3,340 sampled zone-days, the registered primary result is 11.623292072577117%, with a day/row-block mean-bootstrap interval from 10.968255529079848% to 11.628840213097948%. The statistic shows that a measurable part of observed quarter-hour variation occurs among intervals sharing the same hour.
It does not show that the introduction of 15-minute trading caused volatility. The evidence explicitly prohibits that inference because adoption and other regime changes coincide. The analysis is descriptive: finer products may reveal temporal variation that hourly aggregation hid, while market design may also affect behavior through mechanisms not identified here. Detailed interval analysis uses ten representative European bidding zones from 2025-10-01. This is not a household bill study. Analysis and drafting were model-assisted; the working paper is not peer reviewed and is not trading advice.
Plain-language answer
The data can answer the “reveal” part but not the “create” part. About 11.623292072577117% of observed quarter-hour price variance in the registered sample lies within hours. If those quarter hours are replaced by one hourly value, that portion of the observed variation is no longer visible at its native timing.
That does not prove the finer market product generated the variation. Electricity conditions can change inside an hour whether or not a dataset exposes them. At the same time, new products and coupling arrangements can alter bidding, dispatch incentives, and price formation. A credible causal answer would need a design that separates product adoption from simultaneous changes in weather, generation, demand, interconnection, and market rules. This paper does not have that design.
For a household, the immediate implication is about signal resolution rather than a claim that markets became unstable. A quarter-hour tariff or controller can distinguish cheap and expensive sub-hourly intervals. An hourly representation cannot. Whether acting on that distinction lowers a retail bill depends on tariff pass-through, device flexibility, and charges outside this analysis.
Research question
The registered research question is what share of observed quarter-hour price variance occurs within the hour, and whether that descriptive share can distinguish created volatility from revealed volatility. The primary metric is the within-hour share of observed quarter-hour price variance.
The answer is intentionally asymmetric. The variance decomposition can quantify what hourly aggregation conceals. It cannot identify the causal effect of a market redesign because the evidence does not isolate a counterfactual adoption path. The paper therefore treats “created” as unresolved and “revealed” as a property of data granularity.
Data and provenance
The evidence lists daily prices from 2021-01-01 through 2026-08-29, detailed intervals from 2025-10-01 through 2026-08-29, and long history from 2015-01-01 through 2026-08-29. The detailed analysis is limited to ten representative European bidding zones beginning on 2025-10-01. Its short post-change window and selected-zone coverage are central reasons not to make a causal before-and-after claim.
Source tables are zones, day_ahead_prices, grid_revisions, auction_publications, and ingestion_runs. Zone and interval records support grouping by local delivery structure. Revision and publication lineage prevent a current price point from being confused with the state first observed. Ingestion records support completeness and source-state checks.
The publication cutoff is 2026-08-30T00:00:00Z. The analysis ran read-only with a 180-second statement timeout. Snapshot SHA-256 is 7e97489fc8528c8cc8c38830e05b48d949ce1f67b98575dff26f5d7c321e4c67; analysis code, 57c57de79cdab2b5b6d6c54c485cb5162598c5ba0b0bfe995da40d75e6c52ba9; protocol, adb36bf6b447af9f96339249b8becaefc20422499cca1977242866347a97bd4b; paper registry, 7bcb91d7476d0a69fe9fa75a5c7782f8117e0153f82f9112b7e1d307d3943717; source registry, 07949550ac443ff673fda5c0209b99f137544f3ffecf6775f109bb9d09663bd6. The evidence manifest records evidence SHA-256 2efa63a6ecb30644caa2c143848b32602744cf542007e4a520d363e6bac9e3f5 and figure SHA-256 080f183c88b890080207e5ebf0bce2d349805df4fc88a6ea0eb5b5dcbfc8a00b.
The public artifact reports aggregate variance information rather than raw market rows. Its licensing note directs readers to the governing data-licensing materials.
Method
The paper uses the registered family of paired interval reconstruction, clock-safe counterfactuals, and day-block bootstrap. Eligible complete quarter-hour curves are grouped into their corresponding hours using clock-safe interval boundaries. Observed variation is then decomposed into a within-hour component and the broader variation represented by the quarter-hour series.
The primary statistic expresses the within-hour component as a percentage of observed quarter-hour price variance. It is not a price spread, a savings amount, or a probability. A higher share means that more of the observed variation distinguishes intervals inside the same hour; a lower share means that hourly values retain more of the total observed pattern.
Clock-safe grouping is necessary because local hour labels can repeat or disappear at daylight-saving transitions. Physical interval identity must be established before an interval is assigned to a local hour. Otherwise, clock errors can be misreported as price variation.
The artifact labels the interval method day/row-block mean bootstrap, retaining the registered block dependence rather than treating intervals as independent. The evidence applies within-family Holm control to inferential claims but classifies this output as descriptive and makes no unadjusted significance claim. No treatment date or causal coefficient is estimated.
Results
The within-hour share of observed quarter-hour price variance is 11.623292072577117% across a sample size of 3,340 zone-days. The day/row-block mean-bootstrap interval is 10.968255529079848% to 11.628840213097948%. These values show that aggregation to one hourly representation removes a nonzero component of the native observed variation.
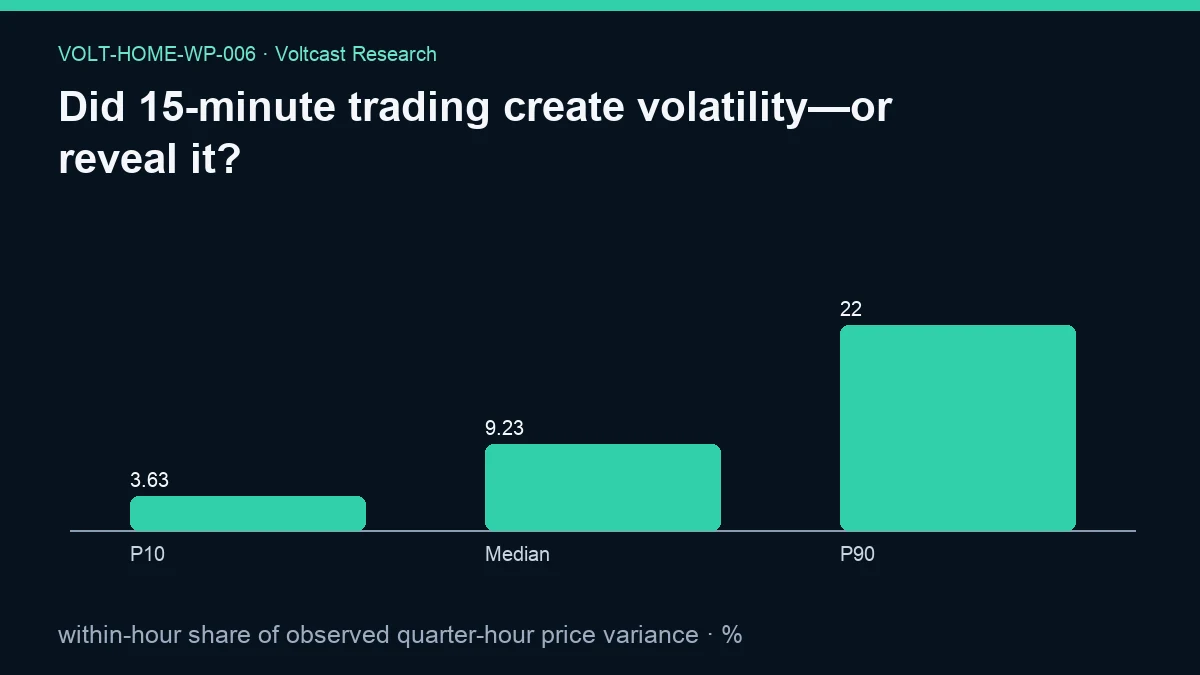
The figure's P10, Median, and P90 labels carry values 3.626555099775281%, 9.23037937576247%, and 21.960395593059015%. They are distributional summaries of zone-day shares, not replacements for the primary aggregate or its uncertainty interval.
The result is not evidence that all hours are volatile or that each zone-day has the same within-hour share. The artifact reports an aggregate primary statistic and uncertainty interval, not a full per-zone or per-season distribution. It also does not say whether the within-hour component is economically useful to a particular flexible device.
Most importantly, the statistic is a decomposition, not a causal effect. The observed quarter-hour variation could reflect underlying physical conditions, the information made expressible by finer products, behavioral responses to market design, or several coincident mechanisms. The paper does not allocate the measured share among those explanations.
Robustness and placebo checks
The decomposition itself is a control against vague volatility claims. It asks where observed variation occurs in the hierarchy rather than comparing unrelated summary statistics. Grouping complete intervals within the same hour holds the hour-level context fixed while examining sub-hourly dispersion.
Clock-safe reconstruction prevents repeated or skipped local labels from fabricating within-hour variance. Revision and publication lineage also matter: mixing different observation versions without a declared rule could add data-state variation to market variation.
The recorded day/row-block mean bootstrap accounts for the registered block dependence among quarter hours. Within-family Holm control governs inferential claims. The narrow interval is reported, but it is not used to smuggle in a causal conclusion.
The strongest causal placebo is refusal: no before-and-after redesign estimate is presented because adoption and regime changes coincide. A simple split would not isolate the market-product effect. That absence is a methodological limitation, not evidence of no causal effect.
Limitations
Detailed intervals cover ten representative European bidding zones from 2025-10-01 through 2026-08-29. The sample does not cover every zone or a long stable regime on both sides of a product transition. Zone-specific market structures may produce different decompositions.
Variance is sensitive to extreme values and regime composition. The public evidence does not publish alternative robust dispersion metrics, per-zone weights, seasonal strata, or outlier diagnostics. The aggregate should be interpreted as the registered statistic, not a universal constant.
The design cannot answer whether 15-minute trading caused volatility. Adoption and regime changes coincide, as the evidence states. A causal analysis would require a credible counterfactual and additional controls that are not part of this paper.
No retail tariff, household profile, device constraint, or bill is observed. This is not a household bill study. A within-hour variance share does not equal consumer savings or loss.
Practical implication
Data and control systems should preserve native quarter-hour values when downstream users can act at that resolution. Hourly summaries remain useful for visualization and coarse planning, but they should be labelled as aggregations. A controller should not pretend an hourly average contains the timing information measured here.
For households, the value of finer data depends on the entire contract: settlement interval, meter interval, supplier pass-through, command interval, and device flexibility. If any component is hourly, the native signal may not be actionable. If all components are quarter-hour capable, aggregation can unnecessarily degrade schedule choices.
Public communication should avoid saying that quarter-hour markets “made prices volatile” based on a variance decomposition. The supported statement is that quarter-hour data reveals within-hour variation. Claims about creation require separate causal evidence.
Reproducibility
The machine-readable evidence is /research-data/home-papers/did-15-minute-trading-create-volatilityor-reveal-it.json. It contains the windows, source contract, metric, sample size, day/row-block mean-bootstrap interval, exact figure values, explicit causal limitation, disclosure, and provenance hashes.
A reproduction should verify snapshot, code, protocol, and registry identities; preserve the publication cutoff and read-only query boundary; select complete eligible quarter-hour curves; and group intervals by clock-safe hour identity. It should document the variance decomposition formula and weighting at the zone-day level.
Interval recomputation should follow the recorded day/row-block mean-bootstrap implementation. Results should be compared exactly with the public percentage, endpoints, and figure vector. A causal extension must be registered separately and may not reinterpret this descriptive output as a treatment effect.
Disclosure
Analysis and drafting were model-assisted; sources, code, assumptions, and evidence hashes are disclosed. This public working paper is not peer reviewed, is not a household bill study, and is not trading advice. Volt has zero live traders and zero live trading capital; C0R is the only paper strategy. Production weather forecasting is a non-trading service. The variance decomposition authorizes no order, capital, or live-trading claim.
References
- Spam Policies for Google Web Search — Scaled content abuse — Google Search Central.
- Single Day-ahead Coupling (SDAC) — ENTSO-E.
- EU electricity trading in the day-ahead markets becomes more dynamic — European Commission.
- ACER Decision 13-2024 on SDAC Products — Agency for the Cooperation of Energy Regulators.
- Voltcast Architecture — Voltcast.