Do cold snaps align high heat demand with high power prices?
Do cold snaps align high heat demand with high power prices. Cold days are associated with different prices; this does not isolate causal heat-pump demand.
Do cold snaps align high heat demand with high power prices?
Abstract
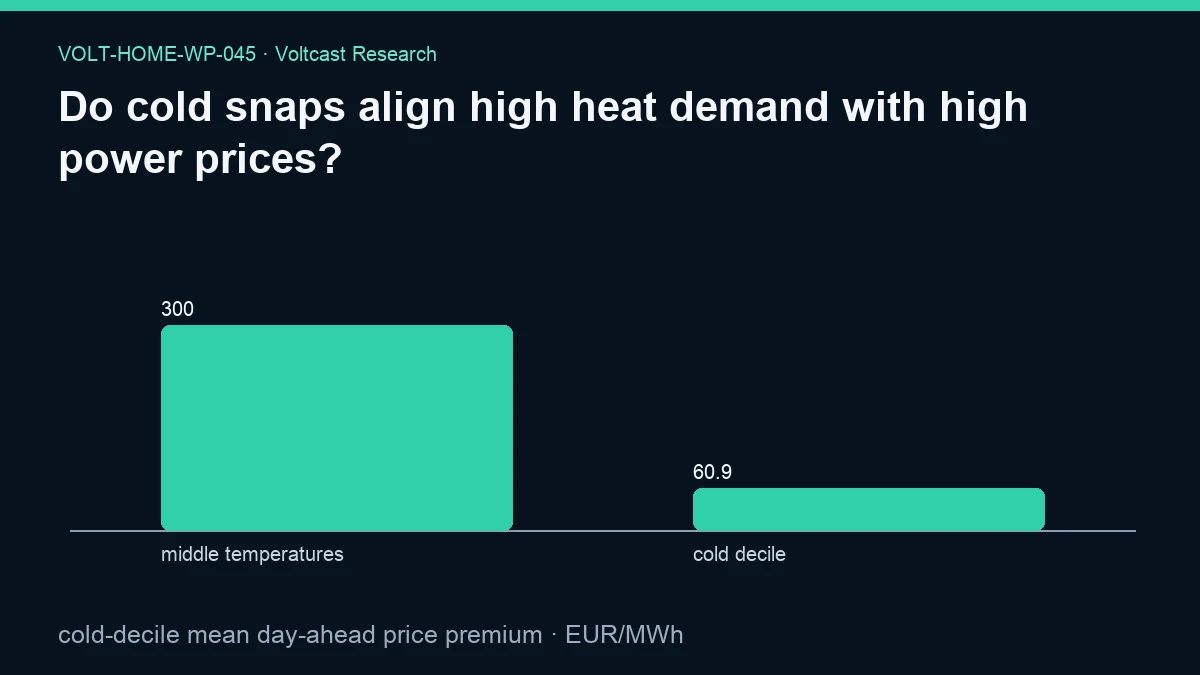
Cold weather raises heating need, but it does not follow that pooled European day-ahead prices must also be higher on the coldest observed days. This working paper compares mean day-ahead price on temperature observations at or below the panel’s tenth percentile with mean price in the fortieth-to-sixtieth-percentile temperature band. The frozen primary result is a cold-decile “premium” of −239.2956048001356 EUR/MWh: the cold group is lower, not higher, than the middle-temperature comparator in this pooled descriptive panel. The cold group contains 237 observations, and no uncertainty interval is reported for this estimand. The figure records 60.85157046413502 EUR/MWh for the cold decile and 300.14717526427063 EUR/MWh for the middle-temperature group. This surprising sign should not be interpreted as a causal effect of cold weather. Zone composition, date composition, crisis periods, market regimes, and aggregation can dominate the comparison. It does not isolate heat-pump load or establish that cold weather protects households from high prices. The reduced-order synthetic scenarios are not building simulations, customer telemetry, savings claims, or retail bills.
Plain-language answer
Not in this frozen pooled comparison. The coldest decile has a much lower mean day-ahead price than the middle-temperature group, producing a −239.30 EUR/MWh difference. Because the metric is named “premium,” the negative sign means a discount in the observed panel.
That answer is descriptive and counterintuitive, so caution is essential. The comparison pools many zone-days rather than following one home or one market through a cold snap. A small set of high-price middle-temperature periods can raise the comparator. Cold conditions may occur in zones or years with systematically lower prices. The Energy and Buildings study is relevant because price alignment with heat demand matters for flexibility, and the Nordic cost–comfort study is relevant because household response remains constrained by comfort. Neither source is used to explain away the observed sign.
Research question
The registered question is whether cold snaps align high heat demand with high power prices. We operationalise “cold snap” as membership in the bottom temperature decile of the matched panel and “middle temperatures” as the fortieth-through-sixtieth percentile. We then compare group means of the recorded daily mean day-ahead price.
The design does not directly observe heat demand. Temperature is a proxy for thermal context, and the paper makes no claim that every cold observation is a heating peak. It also does not estimate a heat-pump causal contribution to electricity prices. The research question is therefore answered as an association in a pooled observational daily panel, not as a mechanism or forecast.
Data and provenance
The publication cutoff is 2026-08-30T00:00:00Z. The evidence declares daily price coverage from 2021-01-01 to 2026-08-29, detailed intervals from 2025-10-01 to 2026-08-29, and long history from 2015-01-01 to 2026-08-29. Its family source-table contract comprises day_ahead_prices, zone_temp_weighted, zone_load, generation_mix, and forecasts.
The operative panel pairs daily day-ahead price summaries with non-null population-weighted zone temperature. The primary sample size reported for the cold group is 237. The analysis also forms a middle-temperature comparator from the same matched panel. It does not use customer heat-pump electricity, indoor temperatures, or appliance telemetry. Although zone load and generation mix are registered family inputs, the primary contrast does not condition on them.
The run was SELECT-only with a 180-second statement timeout. The frozen snapshot SHA-256 is 7e97489fc8528c8cc8c38830e05b48d949ce1f67b98575dff26f5d7c321e4c67; analysis-code SHA-256 is 57c57de79cdab2b5b6d6c54c485cb5162598c5ba0b0bfe995da40d75e6c52ba9; protocol SHA-256 is adb36bf6b447af9f96339249b8becaefc20422499cca1977242866347a97bd4b; registry SHA-256 is 7bcb91d7476d0a69fe9fa75a5c7782f8117e0153f82f9112b7e1d307d3943717; and source-registry SHA-256 is 07949550ac443ff673fda5c0209b99f137544f3ffecf6775f109bb9d09663bd6. The evidence and figure hashes are 3271caf731fbaaf70d6aadd2d721b6c005f311748ee0bb09f05c23af201d0d0a and b3ad09146c8b266a28c8c1675f38430c79c4db32e339c59ef92e89b400ef7439.
The assigned ACER and CEER report, European Commission communication, and dynamic-tariff viability study provide retail-flexibility context. They do not supply the cold threshold, sample, or measured price difference.
Method
For each matched zone-day, the analysis retains the population-weighted temperature and recorded mean day-ahead price. It calculates the tenth percentile of temperature across the panel. Every row at or below that threshold enters the cold group. It also calculates the fortieth and sixtieth temperature percentiles and retains rows between them as the middle-temperature group.
The primary value is mean(cold-group daily mean price) - mean(middle-group daily mean price). A positive result would indicate that the cold group had the higher mean; the observed result is negative. The chart presents both means. The regenerated evidence reports no uncertainty interval for the cold-group price distribution or for the contrast.
The preserved assumptions are synthetic heat demand, no customer telemetry, COP sensitivity declared per paper, and wholesale energy only. No synthetic heat-load quantity is multiplied into this particular contrast. No COP converts outdoor temperature into electrical demand. No load regression, fixed effect, seasonal control, zone weighting, or causal adjustment is introduced.
Within-family Holm control applies to inferential claims. This result is explicitly descriptive and makes no unadjusted significance claim. No confidence interval is reported for the −239.295605 difference, so the point estimate carries no precision claim.
Results
The registered cold-decile mean day-ahead price premium is −239.2956048001356 EUR/MWh. The cold group contains 237 observations. The evidence records no uncertainty interval for the cold-price input or the difference.
The published figure records 60.85157046413502 EUR/MWh for the cold decile and 300.14717526427063 EUR/MWh for middle temperatures. Their gap is consistent with the negative primary contrast. The data therefore reject the simple descriptive premise that the coldest pooled observations necessarily coincide with the highest mean prices.
They do not reject the possibility that cold weather raises prices within a given zone, season, or constrained system. The pooled statistic can exhibit composition effects. Nor does the result show that heat demand was low: no household or heat-pump demand is measured. The defensible finding is only that, under the frozen percentile grouping and pooled sample, cold-group mean price was substantially below the middle-temperature mean.
Robustness and placebo checks
The use of percentile-defined groups makes the temperature cutoffs reproducible and avoids selecting a visually convenient Celsius threshold. The middle-temperature comparator also avoids comparing cold days only with the entire remainder, which could mix hot extremes into the baseline. No blocked interval is reported, so the 237 cold observations establish the sample size but not an uncertainty bound.
However, the evidence contains no zone-fixed-effect robustness, year-stratified result, crisis-period exclusion, seasonally matched control, or within-zone cold anomaly. It also contains no shuffled-temperature placebo. Those checks were not run and must not be implied. Their absence is especially important because the large negative contrast and high middle-temperature mean are compatible with composition effects.
A useful conceptual placebo would compare each zone’s coldest decile with its own middle band before pooling. Another would pair dates within the same month and year. Neither is in the frozen result. Within-family Holm governance remains applicable to inferential extensions, while this paper reports no p-value and no causal inference.
Limitations
Temperature is pooled across zones and dates, so the bottom decile is not necessarily a local cold anomaly. A temperature that is cold in one climate may be normal in another. The design may therefore compare different markets and regimes as much as different thermal conditions.
Daily mean price suppresses intraday peaks that may matter to heating schedules. A cold day with an expensive morning and cheap remainder can have a moderate daily mean while still presenting operational risk. The analysis does not test whether high heat demand and high prices align in the same quarter-hour.
No heat demand is observed. Population-weighted outdoor temperature cannot identify insulation, occupancy, thermostat settings, heating technology, COP, or load. Daily temperature and price summaries cannot reproduce a building-specific thermal state. The result is association only and does not isolate causal heat-pump demand.
Wholesale prices are not retail tariffs. Taxes, network charges, supplier margins, fixed charges, and consumer protection can change household exposure. The reduced-order synthetic scenarios are not building simulations, customer telemetry, savings claims, or retail bills. The negative “premium” must not be marketed as evidence that cold-weather heating is cheap.
Practical implication
Do not hard-code a controller rule that assumes the coldest day will also be the most expensive, or the cheapest. Use the actual published local price curve, the complete retail tariff, a conservative temperature forecast, and the home’s physical limits. Cold-weather safety and comfort should override price scheduling.
For analysis, stratify future work within zone and season before using temperature as a price-risk signal. The current result is valuable precisely because it contradicts a simple narrative and exposes the need for composition-aware controls. Retail contract choice, as framed by the assigned policy sources, determines how much of any wholesale association reaches a household.
Reproducibility
The public evidence file is /research-data/home-papers/do-cold-snaps-align-high-heat-demand-with-high-power-prices.json, and the corresponding figure is /research-media/home-papers/do-cold-snaps-align-high-heat-demand-with-high-power-prices.webp. The JSON freezes the primary metric, sign, sample size, explicit null interval, assumptions, coverage windows, source tables, limitations, interpretation, disclosure, and provenance hashes.
To reproduce the statistic, join frozen daily price summaries to non-null population-weighted zone temperatures. Calculate the panel temperature tenth, fortieth, and sixtieth percentiles. Select cold rows at or below the tenth percentile and middle rows between the fortieth and sixtieth percentiles. Take each group’s arithmetic mean daily price and subtract middle from cold. Preserve the pooled design; adding zone or seasonal controls creates a different, potentially better analysis but not a reproduction.
Use the exact snapshot and publication cutoff. Later market observations can materially change percentile membership and group composition. Licensing and attribution are documented at /legal/data-licensing and Voltcast data licensing and redistribution.
Disclosure
Analysis and drafting were model-assisted; sources, code, assumptions, and evidence hashes are disclosed. This working paper is not peer reviewed. It makes no trading claim and is not trading advice. Volt has no live traders or live capital. The result is not a weather forecast, heat-demand forecast, retail-price forecast, or instruction for equipment operation.
References
- Energy and Buildings. “Assessment of the thermal energy flexibility of residential buildings with heat pumps under various electric tariff designs.” https://doi.org/10.1016/j.enbuild.2023.113257
- Energies. “Exploring Cost–Comfort Trade-Off in Implicit Demand Response for Fully Electric Solar-Powered Nordic Households.” https://doi.org/10.3390/en18215568
- ACER and CEER. “Rewarding flexibility: How retail contract choice can help unlock consumer flexibility.” https://www.ceer.eu/wp-content/uploads/2025/11/ACER-CEER-2025-Retail-monitoring.pdf
- European Commission. “Communication from the Commission on the Citizens Energy Package.” https://eur-lex.europa.eu/legal-content/EN/TXT/?uri=CELEX%3A52026DC0115
- Advances in Applied Energy. “Assessing the conditions for economic viability of dynamic electricity retail tariffs for households.” https://doi.org/10.1016/j.adapen.2024.100174