What happens to local prices when generation capacity goes offline?
What happens to local prices when generation capacity goes offline. The event comparison is not causal because outage timing and system stress are jointly determined.
Abstract
Generation outages are often expected to tighten supply and raise electricity prices. This working paper reports what the frozen public daily panel actually shows without forcing that expected sign. A zone-day is classified as an outage day when recorded unavailable generation capacity is greater than zero. Its daily mean day-ahead price enters the event group; all other available zone-days enter the comparison group. The reported statistic is the event-group mean minus the non-outage-group mean.
The evidence contains 1,953 outage zone-days and reports a difference of -115.433502 EUR/MWh. Recorded outage days therefore had substantially lower mean prices than non-outage days in this unadjusted pooled comparison. That counterintuitive sign must not be interpreted as evidence that taking capacity offline lowers prices. The event and comparison groups differ across zones, dates, seasons, outage-reporting practices, and wider system conditions. Outages can be planned in low-demand periods, can coincide with abundant production elsewhere, and can be endogenous to market conditions.
The study is observational and daily. It does not match comparable event and control days, estimate an event-time path, distinguish planned from forced outages, weight unavailable megawatts, or identify whether the unavailable unit was marginal. The measured result is valuable primarily as a warning: a naive event-versus-all-other-days comparison is heavily confounded. This paper makes no causal, retail-savings, or trading claim.
Plain-language answer
In the frozen dataset, days with any recorded unavailable generation capacity had lower average day-ahead prices than days without such a record. The difference, calculated as outage-day mean minus non-outage-day mean, is -115.434 EUR/MWh across 1,953 outage zone-days.
That does not mean an outage caused prices to fall. It means the two broad groups are not comparable enough to answer the causal question. A planned maintenance outage may be scheduled when demand is low. Different countries may report outages differently. The no-outage group can include crisis periods in zones with sparse outage records. Power can be imported from neighboring zones, and low fuel costs or abundant renewable generation can dominate the local capacity change.
The household takeaway is not “outages make electricity cheap.” It is that outage data need context before they are used in an alert, forecast, or explanation. A local day-ahead curve remains the direct wholesale signal. Any statement about the price effect of unavailable capacity needs a better design that compares like with like and preserves event timing.
Research question
The registered question is what happens to local prices when generation capacity goes offline. The implemented estimand is the unadjusted difference in mean daily day-ahead prices between zone-days with positive recorded unavailable megawatts and all other zone-days.
This estimand is descriptive. “When” refers to same-day coexistence, not a causal event window. “Generation capacity” refers to capacity represented in the outage table, not every derating or operational constraint. “Local prices” means bidding-zone daily mean day-ahead prices, not retail bills or the price at the exact interval when a unit changed status.
A causal version would need to define an outage’s announcement and effective clocks, separate anticipated maintenance from unexpected failure, measure unavailable capacity relative to the local system, select matched controls, and trace prices before and after the event. The current evidence does not contain that design. The paper therefore asks what is observed in the simple split and treats the result as a diagnostic of confounding.
Data and provenance
The public evidence is /research-data/home-papers/what-happens-to-local-prices-when-generation-capacity-goes-offline.json. It is marked measured, uses a publication cutoff of 2026-08-30T00:00:00Z, and records the corpus daily-price span as 2021-01-01 to 2026-08-29. The metadata also identifies detailed intervals from 2025-10-01 and a long price history beginning in 2015. The outage result itself is built from daily aggregates rather than interval event time.
The registered family permits border_flows, day_ahead_prices, outage_events, generation_mix, and zone_load. The headline implementation creates an outage lookup from outage_events and compares day_ahead_prices. It does not condition on flows, generation mix, or load, even though those contracts could support a future controlled study. Their presence in frontmatter provenance must not be mistaken for adjustment variables.
The analysis ran against a SELECT-only production snapshot with a 180-second timeout. The snapshot SHA-256 is 7e97489fc8528c8cc8c38830e05b48d949ce1f67b98575dff26f5d7c321e4c67. The analysis source is bound by SHA-256 57c57de79cdab2b5b6d6c54c485cb5162598c5ba0b0bfe995da40d75e6c52ba9, the outcome-free protocol by adb36bf6b447af9f96339249b8becaefc20422499cca1977242866347a97bd4b, the paper registry by 7bcb91d7476d0a69fe9fa75a5c7782f8117e0153f82f9112b7e1d307d3943717, and the source registry by 07949550ac443ff673fda5c0209b99f137544f3ffecf6775f109bb9d09663bd6.
ENTSO-E’s SDAC page describes the coupled environment in which cross-border constraints and market outcomes interact. The European Commission’s market-time-unit page is relevant to native temporal resolution. The IEA’s report provides grids and flexibility context. The ACER–CEER report explains why wholesale conditions do not map mechanically to every household contract. Voltcast’s architecture specifies the internal outage-adjacent price and timestamp contracts. None supplies the paper’s measured -115.433502 EUR/MWh value; that number is from the frozen evidence.
Method
The routine first builds a dictionary keyed by zone code and UTC date. Each entry contains the recorded unavailable megawatts for that zone-day, with a zero fallback when no positive value is found. It then iterates through all available daily-price rows.
If the lookup value is greater than zero, the zone-day’s daily mean price enters the event list. Otherwise it enters the control list. The primary result is:
mean(event-day prices) - mean(control-day prices).
The event sample passed into the evidence object has 1,953 values. The non-event sample size is not reported in the JSON, so it is not invented here. The method does not weight events by unavailable capacity, plant size, fuel, duration, start time, expected return, or local load. It does not require that the outage began on the price date, was unexpected before the auction, or removed a price-setting unit.
The regenerated evidence reports no bootstrap interval and names the interval method “not reported for this estimand.” No uncertainty bound is claimed for the -115.433502 EUR/MWh difference. Valid inference would resample the entire group-difference procedure with zone and temporal dependence preserved.
Results
The measured event group contains 1,953 outage zone-days. The unadjusted outage-day mean price difference from non-outage days is -115.43350229381846 EUR/MWh. Rounded to three decimals, outage days are 115.434 EUR/MWh lower in this pooled comparison.
The sign runs against a simple “less capacity means higher prices” expectation. It should be treated as evidence that the comparison is confounded, not as a newly discovered inverse law. Because the result pools different zones and periods without matching or controls, group composition can dominate the within-zone effect of any one outage.
No secondary results accompany the estimate. The evidence does not reveal outage megawatt distributions, planned-versus-forced categories, per-zone effects, event-time coefficients, import response, or household bill changes.
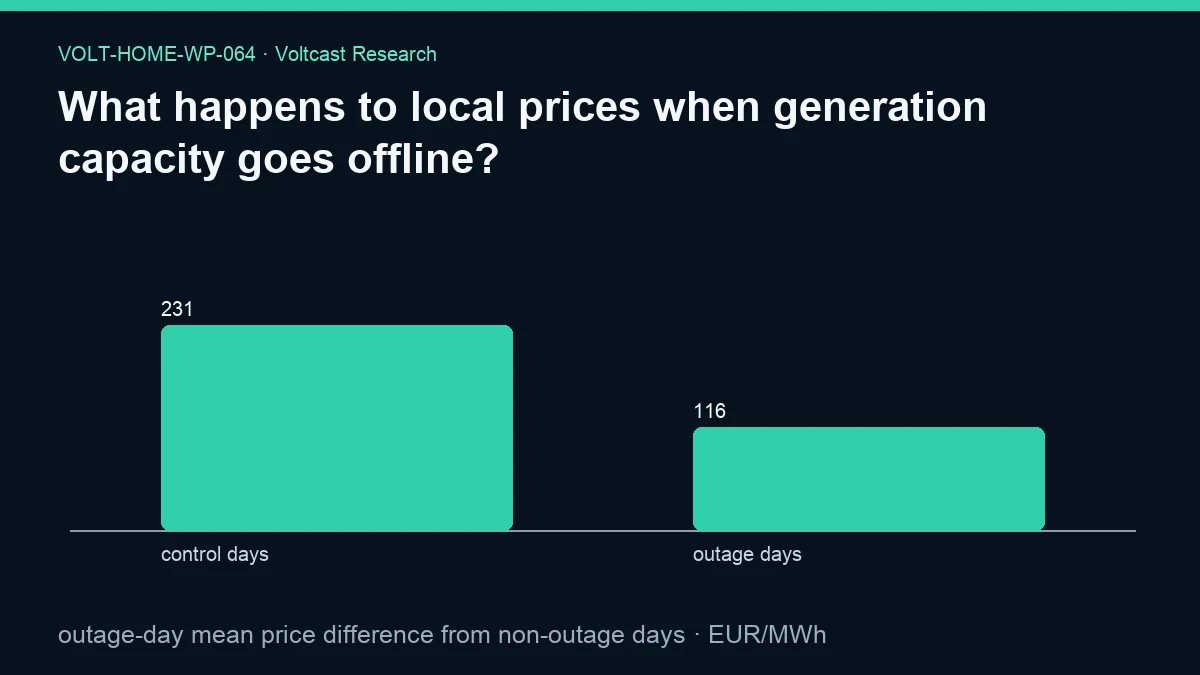
The regenerated figure does report the two group means. Its labels are “control days” and “outage days,” with values 231.46728002039296 and 116.0337777265745 EUR/MWh, rendered as 231 and 116. Their subtraction reproduces the primary -115.43350229381846 EUR/MWh contrast. These visual values remain unadjusted group means, not causal effects.
Robustness and placebo checks
The broader method family names event studies and placebo windows, but this public result is a simple event/control split. No paper-specific placebo estimate is reported. The registered multiplicity statement says Holm control applies to inferential claims; this paper makes no unadjusted significance claim.
The classification rule is reproducible and intentionally simple: positive recorded unavailable megawatts defines an event. That clarity helps expose, rather than hide, its weaknesses. Requiring a zone-date match prevents an outage in one zone from directly labeling another zone’s day, yet a coupled network means neighboring conditions may still matter. Using daily means reduces sensitivity to individual price spikes, but it also destroys the timing needed to assess the immediate response.
A credible robustness programme would separate planned and unplanned outages, match event days by zone, season, load, generation mix, and neighboring conditions, weight or stratify by unavailable capacity, inspect pre-event trends, and assign placebo event dates. It would also distinguish the outage announcement from the physical unavailability and the day-ahead auction clock. None of those results is present. The current estimate remains a measured descriptive contrast with an explicit failure of causal identification.
Limitations
Selection into outage status is not random. Maintenance can be scheduled in low-demand seasons, while forced outages can occur under different regimes. Reporting coverage can vary by market and technology. A missing outage record is treated in the simple split as a control condition even though absence of a row is not necessarily proof of full availability.
The outcome is a daily mean. An outage lasting a few intervals is compared with a full-day average, and the analysis cannot establish whether the outage was known before the day-ahead price formed. It cannot distinguish a local event from system-wide stress or neighboring support. Imports, reserves, renewable output, demand, fuel costs, and other outages can mediate or confound the observed price.
Pooled levels across zones and years are especially vulnerable to composition effects. Zones have different typical price levels and outage fleets. The 2021-01-01 to 2026-08-29 span covers changing market regimes. Without zone and date controls, a difference of means can mostly reflect which observations fall into each group.
The evidence reports no interval for the group difference, and the paper does not make a significance claim. Finally, a wholesale EUR/MWh contrast does not equal a household bill impact. Retail charges, contract hedging, taxes, network tariffs, and consumption timing are outside the design.
Practical implication
Outage information should be presented as one input among many, with reporting time, event window, unavailable capacity, and uncertainty visible. Household automation should not change behavior solely because an outage exists, and public explanations should not claim a deterministic price direction from this pooled result.
For researchers, the negative estimate is a useful specification warning. Before estimating an outage effect, compare within zones, align the information clock, and build matched or quasi-experimental controls. For households, continue to use the actual local price curve; outage context may help explain it only after the event’s timing and comparability are established.
Reproducibility
Exact reproduction requires the frozen outage and daily-price aggregates. Map each (zone_code, utc_date) to unavailable megawatts, classify a price row as event when the mapped value exceeds zero, place all other rows in the comparison group, and subtract the control mean from the event mean. The expected event count is 1,953 and the expected difference is -115.43350229381846 EUR/MWh.
Reproducers should verify UTC-date alignment, duplicate outage aggregation, null handling, price completeness, and whether absent records are treated as zero. Altering the event threshold, matching controls, using local dates, weighting megawatts, or analyzing quarter-hours would create a new and potentially better study, but not an exact reproduction. Licensing is disclosed at /legal/data-licensing and the canonical licensing document.
Disclosure
Analysis and drafting were model-assisted. This working paper is not peer reviewed. It reports a counterintuitive association without assigning it a causal mechanism and explicitly identifies the daily-panel and confounding limits. No customer outcomes or savings are measured. Volt has no live traders or live capital. This document is household-energy research, not trading advice or a recommendation to act on outage information.
References
- ENTSO-E — Single Day-ahead Coupling (SDAC)
- European Commission — EU electricity trading in the day-ahead markets becomes more dynamic
- International Energy Agency — Electricity 2026
- ACER and CEER — Rewarding flexibility: How retail contract choice can help unlock consumer flexibility
- Voltcast — Voltcast Architecture