Do cross-border flows reverse around negative-price events?
Do cross-border flows reverse around negative-price events. Direction changes describe coupling dynamics; negative-price timing is examined as a robustness stratum.
Abstract
This working paper was registered to ask whether cross-border flow direction changes around negative day-ahead price events. The public evidence reports a narrower statistic: the day-to-day sign-reversal rate across consecutive observed daily mean-flow rows within each directed border link. A reversal is coded when the product of the prior and current signed mean flows is below zero. The analysis then averages indicators coded as zero or one hundred.
Across 61,796 consecutive link-row comparisons, the reported reversal rate is 0.0%. In the analyzed daily representation, none of those paired signed mean-flow values crossed from strictly positive to strictly negative or vice versa. This is a measured property of the frozen aggregate and direction convention. It is not a complete answer to the registered title because the public evidence provides no separate statistic for negative-price days, adjacent event windows, or matched non-event days.
Several explanations remain possible, including stable directional link conventions, persistent net direction in daily averages, within-day reversals hidden by averaging, zero-valued means, and characteristics of the available flow data. The result does not prove that physical or scheduled flows never reverse, and it does not establish how negative prices affect direction. This paper preserves that gap rather than inferring an event-specific conclusion. It is descriptive household-energy research, not a causal study or trading advice.
Plain-language answer
The daily-flow calculation found a 0.0% sign-reversal rate across 61,796 consecutive observations within directed links. In that exact aggregate, a positive daily mean was never followed by a negative daily mean, and a negative daily mean was never followed by a positive daily mean under the strict rule used.
But the evidence does not separately examine negative-price events. It does not tell us how many of the comparisons occurred before, during, or after a negative-price day, nor does it compare those cases with ordinary days. Therefore the safe answer to the title is: the overall daily statistic shows no recorded reversals, but this artifact is insufficient to say whether negative prices change the reversal tendency.
This distinction matters to households because a negative local price is not a complete map of regional power movement. Prices, scheduled exchanges, constraints, generation, and demand interact. A home controller should respond to its local price and verified tariff rules, not assume that a negative-price event means a border must reverse.
Research question
The intended question has an event component and a flow-direction component. An appropriate estimand would define a negative-price event, select a before-and-after window, identify stable border directions, and compare reversal frequency around events with a prespecified non-event control.
The implemented estimand covers only the flow-direction component. Within each (from_zone, to_zone) group, daily observations are sorted by their stored date. Consecutive rows are compared, and a reversal occurs only if the product of signed daily mean flows is less than zero. The reported value is the percentage of comparisons meeting that condition.
“Consecutive rows” is not necessarily identical to consecutive calendar days if a link has missing dates. “Daily mean flow” is not the same as every interval’s direction. “Around negative-price events” is not operationalized in the published primary output. These boundaries prevent the 0.0% result from being promoted into a stronger event-study claim.
Data and provenance
The evidence contract is /research-data/home-papers/do-cross-border-flows-reverse-around-negative-price-events.json. Its status is measured, with publication cutoff 2026-08-30T00:00:00Z. The corpus records daily prices from 2021-01-01 to 2026-08-29, detailed intervals from 2025-10-01, and long price history from 2015-01-01. The measured reversal statistic is based on daily flow-price panel rows; detailed intervals are not used to detect within-day direction changes.
The preregistered source contracts are border_flows, day_ahead_prices, outage_events, generation_mix, and zone_load. The reversal implementation uses directional daily flow rows grouped by link. Although day-ahead prices are part of the family contract and title, the public primary calculation does not report a negative-price filter. Outages, generation mix, and load are also not reported as covariates for this result.
The frozen source was queried in a read-only transaction with a 180-second statement timeout. Snapshot SHA-256 is 7e97489fc8528c8cc8c38830e05b48d949ce1f67b98575dff26f5d7c321e4c67; analysis-code SHA-256 is 57c57de79cdab2b5b6d6c54c485cb5162598c5ba0b0bfe995da40d75e6c52ba9; protocol SHA-256 is adb36bf6b447af9f96339249b8becaefc20422499cca1977242866347a97bd4b; paper-registry SHA-256 is 7bcb91d7476d0a69fe9fa75a5c7782f8117e0153f82f9112b7e1d307d3943717; and source-registry SHA-256 is 07949550ac443ff673fda5c0209b99f137544f3ffecf6775f109bb9d09663bd6.
ENTSO-E’s SDAC material explains that scheduled exchanges and clearing outcomes arise within a coupled process. The European Commission source documents finer day-ahead time units, which helps explain why daily averages can be lossy. The IEA provides system flexibility context, ACER and CEER provide consumer-contract context, and Voltcast’s architecture describes UTC and native-resolution storage. These references frame interpretation; they do not supply an unreported negative-event comparison.
Method
The grid-family routine first matches flow rows to endpoint daily prices, creating records with source, destination, date, signed daily mean flow, and price-spread fields. For the reversal paper, records are grouped by directed source-destination pair. Each group is sorted lexically by ISO date, which is chronological for the stored date format.
Every adjacent pair of group rows is evaluated. If prior_flow * current_flow < 0, the indicator is 100.0; otherwise it is 0.0. The mean of those indicators is the percentage reversal rate. Strict inequality means that a transition involving exactly zero is not counted as a reversal, even if the nonzero signs on either side differ.
The method does not check that adjacent rows are one calendar day apart. It does not inspect quarter-hour or hourly flow direction, and it does not use a threshold to distinguish a meaningful reversal from a tiny sign change. Most importantly, it does not partition comparisons by negative-price event status in the published implementation.
The evidence records a day/row-block mean bootstrap interval of 0.0% to 0.0% because every supplied indicator is zero. That reproduces the sample’s lack of coded reversals but does not address model uncertainty, data convention risk, missing dates, or the absent event stratification. A zero empirical rate is not proof that the underlying probability is universally zero.
Results
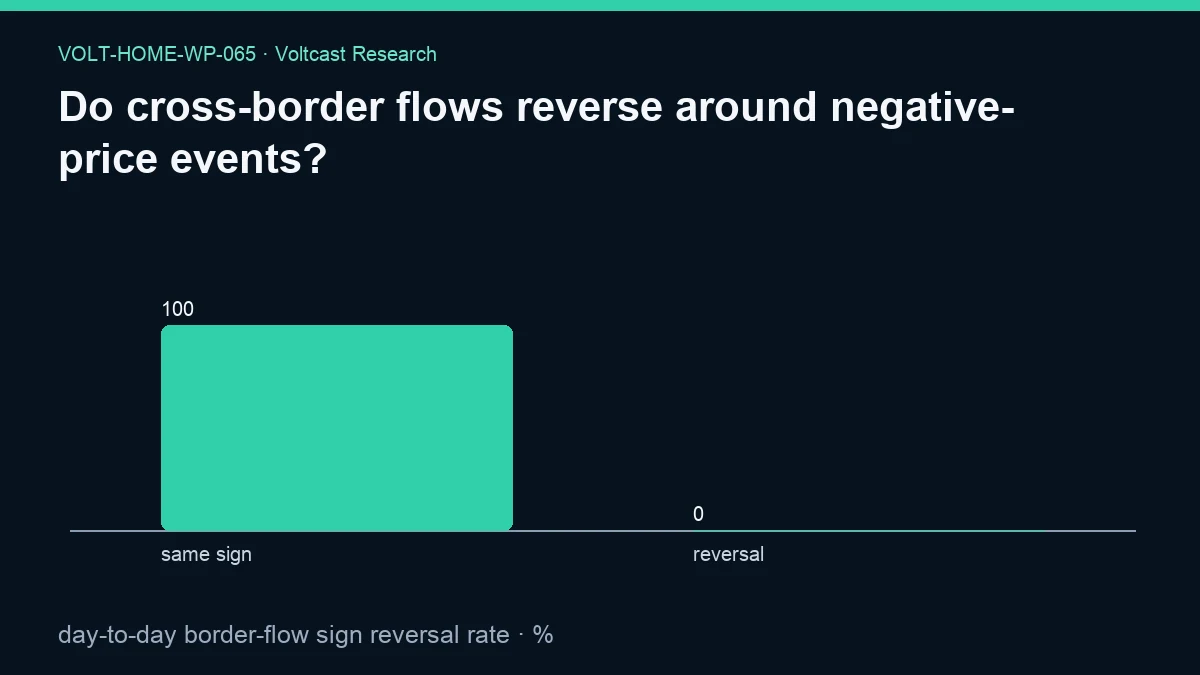
The sample contains 61,796 adjacent within-link comparisons. The reported day-to-day border-flow sign reversal rate is 0.0%. Under the exact strict product rule, every comparison is coded “same sign” rather than “reversal.”
This is an unusually sharp descriptive output. Its most defensible interpretation is that the daily directional representation did not expose a sign crossing in the analyzed pairs. It may reflect persistent directional series or the way each directed border flow is encoded. It cannot establish the absence of changes within a day, and it says nothing quantitative about negative-price timing.
The figure uses the labels “same sign” and “reversal,” with values 100.0% and 0.0%. Those bars and the 0.0% to 0.0% resampling interval reflect the same all-zero reversal indicators; they do not add an event-specific negative-price comparison.
No secondary result is present. The evidence does not report the number of negative-price events, links represented, missing-day gaps, zero-flow comparisons, flow-magnitude distribution, interval reversals, or event-versus-placebo rates. The line saying negative-price timing is examined as a robustness stratum is not accompanied by a numerical stratum result. This paper does not invent one.
Robustness and placebo checks
The all-zero result is mechanically robust to resampling the same zero indicators: any sample mean remains zero. That is a check of arithmetic, not of substantive validity. A different reversal definition, temporal resolution, link convention, or event filter could produce a different answer.
The strict sign test is symmetric for positive-to-negative and negative-to-positive changes. Grouping by directed link avoids comparing unrelated borders. Sorting dates makes the adjacency rule reproducible. At the same time, no continuity check ensures adjacent calendar days, and zeros break what might otherwise be a sign transition.
The registered family mentions placebo windows, but the evidence has no placebo output for this paper. A proper negative-event design would define event days from local endpoint prices, compare prespecified leads and lags, use calendar-matched non-events, and report link-blocked uncertainty. It should test whether the result survives native interval flows and stable border-orientation rules. Without those checks, “around negative-price events” remains unanswered even though the overall daily rate is measured.
The responsible robustness statement is therefore two-part: exact reruns of the frozen daily indicator should return zero; generalization to event-specific or interval-level flow reversal is unsupported.
Limitations
Daily averaging can conceal multiple within-day reversals. A mean close to one direction says nothing about every settlement interval. The move to finer market time units makes this compression particularly important for household automation that may act on quarter-hour prices.
The flow sign may reflect a stable data-series orientation rather than a freely changing physical direction. Separate directed records, nominations, netting, and database conventions require validation before interpreting signs. The calculation does not expose the number of links or their individual coverage. Consecutive observations can span missing dates.
The strict product rule ignores zero transitions. Measurement noise around zero is not separated from meaningful exchange. Flow magnitude does not affect the indicator. Network constraints, demand, generation, outages, and common shocks are not controlled.
The central limitation is that the title names negative-price events, while the primary result is unconditional. The public evidence contains no event definition, event count, window, control, or event-specific estimate. As a result, it cannot support causal language or even a descriptive comparison of negative and non-negative periods.
Finally, a cross-border flow pattern is not a household saving. Retail exposure, taxes, network charges, metering, and consumption are outside this analysis. No action should be inferred for an individual household from the 0.0% aggregate.
Practical implication
Data products should not translate a negative local price into a statement that neighboring flows reversed. If flow direction is shown to households or journalists, the display should include source orientation, resolution, timestamp, and whether the value is scheduled, measured, or averaged.
For research, the next honest step is not to reinterpret the zero. It is to preregister an actual negative-price event study using native-resolution flow data, continuity checks, and matched controls. Until then, the finding is limited to the absence of coded reversals in the daily series.
Reproducibility
Reconstruct the matched grid rows, group by exact directed (from_code, to_code) identity, sort each group by ISO date, and compare adjacent signed daily mean flows. Code 100.0 when their product is strictly below zero and 0.0 otherwise, then calculate the arithmetic mean. Exact reproduction should yield 61,796 indicators and a mean of 0.0%.
Reproducers should additionally audit date gaps, zero values, reciprocal-link conventions, and native units, even though those audits do not change the frozen definition. Adding a negative-price filter or using detailed intervals would answer a different and more relevant question, so it must be labeled as a new analysis. Licensing is disclosed at /legal/data-licensing and the canonical licensing document.
Disclosure
This analysis and paper were model-assisted and are not peer reviewed. The draft explicitly exposes that the measured statistic is unconditional despite the event-specific title. It does not infer missing negative-price findings, customer savings, or a causal mechanism. Volt has no live traders or live capital. This is not trading advice, financial advice, or an instruction for household automation.
References
- ENTSO-E — Single Day-ahead Coupling (SDAC)
- European Commission — EU electricity trading in the day-ahead markets becomes more dynamic
- International Energy Agency — Electricity 2026
- ACER and CEER — Rewarding flexibility: How retail contract choice can help unlock consumer flexibility
- Voltcast — Voltcast Architecture