Do negative prices propagate across European borders?
Do negative prices propagate across European borders. Co-occurrence along observed border links is descriptive and does not prove physical propagation.
Do negative prices propagate across European borders?
Abstract
This working paper measures how often negative wholesale-price days co-occurred across observed neighboring market links. The evidence reports neighbor-day negative-price co-occurrence of 58.47749065828621%, based on a sample size of 160. The corrected evidence intentionally reports no bootstrap interval for this estimand. The result establishes a substantial descriptive overlap in the registered sample. It does not show that one zone’s price event physically traveled into another zone, identify which zone led, or prove that a cross-border flow caused the shared outcome.
The distinction is essential because the primary statistic is aggregated by day. Two neighbors can each experience at least one negative interval on the same day at different times, under different local conditions, or while a border is constrained. The data contract includes day-ahead prices and border flows, but the published result is a co-occurrence statistic rather than a directional flow model. This paper therefore treats “propagate” as the hypothesis motivating the comparison, not as an established mechanism. It is model-assisted, not peer reviewed, not a household bill study, and not trading advice.
Plain-language answer
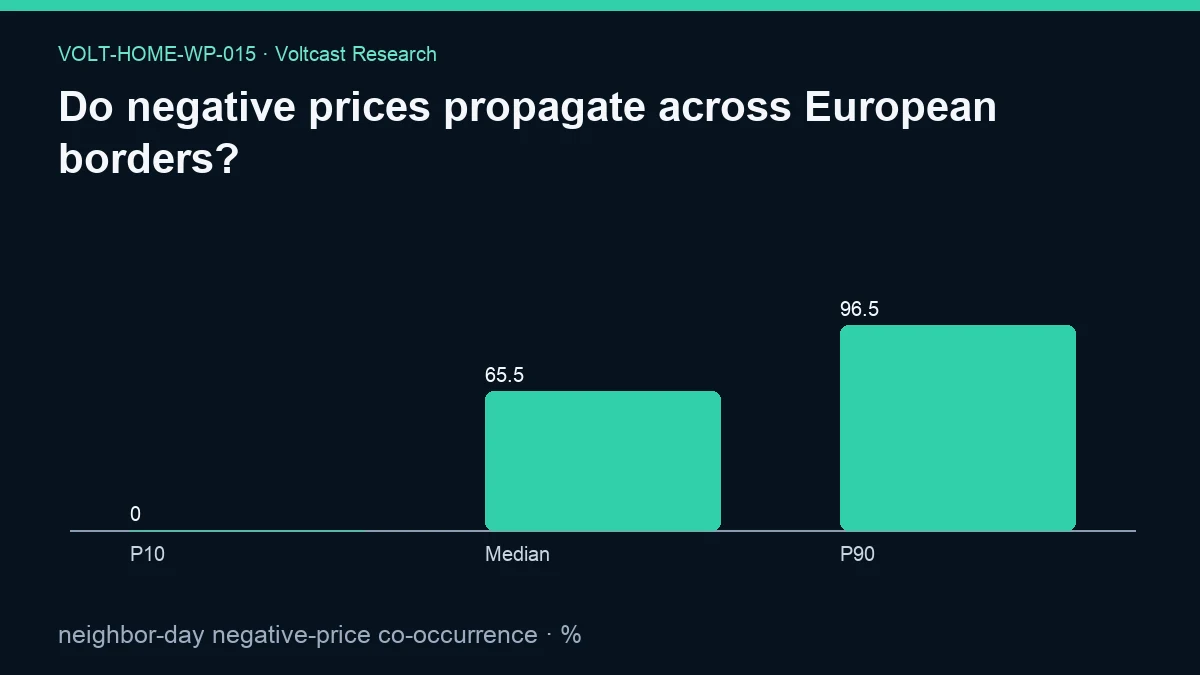
Neighboring linked markets often had negative-price days at the same time in this sample: the recorded co-occurrence was about 58.48%. The figure’s machine-readable P10, Median, and P90 values are 0.0%, 65.45130035696073%, and 96.46590058556774%. Those are distribution summaries for the plotted co-occurrence values, not uncertainty bounds around the 58.47749065828621% primary result.
It does not answer which market moved first or whether electricity flowed from the negative-price zone toward the other zone. A same-day label is coarse. One zone could turn negative in the morning and its neighbor in the evening. Both could respond to common weather, demand, or wider market conditions. A border might be available, constrained, or flowing in either direction. Co-occurrence is therefore evidence of association across connected geography, not proof of propagation.
Research question
The primary question is: among observed European neighboring-zone relationships in the frozen dataset, what share of relevant neighbor-day observations show negative-price events in both places? The registered metric is “neighbor-day negative-price co-occurrence,” expressed as a percentage.
A stronger propagation question would require ordered event times, directional border flows, available capacity, and a design distinguishing a transmitted shock from simultaneous exposure to common conditions. The current evidence does not publish those estimates. This paper asks the narrower question that the supplied statistic can answer and uses the stronger title to explain why the descriptive result is insufficient for a causal claim.
Data and provenance
The evidence declares daily price coverage from 2021-01-01 through 2026-08-29, detailed interval coverage from 2025-10-01 through 2026-08-29, and long-history coverage from 2015-01-01 through 2026-08-29. The registered result is explicitly daily. The limitation says daily aggregation cannot identify within-day direction or causal transmission, so no interval-level lead-lag conclusion should be inferred from the broader presence of detailed data.
The family source tables are day_ahead_prices, generation_mix, border_flows, risk_accuracy, and zone_holidays. Day-ahead prices identify negative-price days, and border information identifies observed neighboring links. The evidence does not say the co-occurrence estimate conditions on contemporaneous flow direction, capacity, or congestion. Generation, forecast-risk, and holiday tables are part of the family contract but are not reported as controls in the primary result.
The current public-evidence JSON SHA-256 is a7f1262de7df7b620848ac79b8f7686114c5720d839ca91399572d380fbb6138. The analysis uses a read-only transaction with a 180-second statement timeout and a publication cutoff of 2026-08-30T00:00:00Z. The frozen identities are analysis-code SHA-256 57c57de79cdab2b5b6d6c54c485cb5162598c5ba0b0bfe995da40d75e6c52ba9, protocol SHA-256 adb36bf6b447af9f96339249b8becaefc20422499cca1977242866347a97bd4b, registry SHA-256 7bcb91d7476d0a69fe9fa75a5c7782f8117e0153f82f9112b7e1d307d3943717, snapshot SHA-256 7e97489fc8528c8cc8c38830e05b48d949ce1f67b98575dff26f5d7c321e4c67, and source-registry SHA-256 07949550ac443ff673fda5c0209b99f137544f3ffecf6775f109bb9d09663bd6. No assumptions are registered.
Method
The method first identifies whether each zone-day contains a negative day-ahead price event under the analysis definition. It then uses observed border links to form neighboring comparisons and asks whether both linked zones have a negative event on the same day. The resulting co-occurrence share is summarized across the registered sample of 160.
This design preserves the network relationship: pairs are not formed arbitrarily between every market. However, a link indicates adjacency or observed connection, not necessarily unconstrained transmission at the relevant time. Daily reduction also discards event order, overlap duration, price depth, flow direction, and capacity state. Those omitted dimensions are precisely what a causal propagation study would need.
The corrected evidence records bootstrap_95_interval as null and the interval method as “not reported for this estimand.” It also states that within-family Holm control applies to inferential claims and that this descriptive result makes no unadjusted significance claim. No unsupported uncertainty interval is attached to the primary co-occurrence estimate.
Results
Neighbor-day negative-price co-occurrence is 58.47749065828621% in the registered sample. The sample size is 160. The result means that shared negative-price days occurred in more than half of the analyzed neighbor observations under the study’s eligibility rules. The figure reports a separate P10/Median/P90 distribution of 0.0%, 65.45130035696073%, and 96.46590058556774%.
The measurement does not say that 58.47749065828621% of all European negative-price events cross a border. The denominator is the study’s neighbor-day sample, not all price intervals, all events, all borders, or all days. It also does not state that the co-occurrence rate is greater than a matched non-neighbor baseline. Without that contrast, geographic connection and common regional conditions remain intertwined.
No direction is measured. A shared day can be consistent with movement from one zone to another, reverse movement, simultaneous market-wide conditions, or independent events. The result should therefore be described as border-linked co-occurrence. Calling it measured propagation would overstate what daily aggregation can identify.
Robustness and placebo checks
No bootstrap interval is reported for the registered co-occurrence estimand. That is an intentional uncertainty-handling choice. A future supported interval would need a resampling design that respects repeated observations by border, zone, or day because independent-row resampling could understate uncertainty if observations share markets or dates.
A persuasive placebo would compare linked neighbors with carefully matched non-neighbor pairs, preserving calendar, price-frequency, and regional structure. Another check would shift one zone’s dates or use event times to test whether overlap is truly simultaneous. Directional robustness would incorporate flow sign and available capacity at the event interval. No numerical placebo outputs are included in the evidence, so this paper does not claim those tests passed.
The method family names network lead-lag analysis, and Holm control applies to inferential claims across the family. Yet this paper’s primary result remains descriptive. The robustness boundary is explicit: the figure percentiles describe cross-observation variation, while formal interval uncertainty is not reported and causal propagation awaits a finer design.
Limitations
Daily aggregation is the defining limitation. It cannot tell whether negative intervals overlap, which zone leads, or how quickly a price movement appears elsewhere. It can also classify a day as shared even when the events are separated by many hours. This loss of timing makes a propagation interpretation unavailable.
The evidence does not publish the 160 sample units, border identities, weighting, or eligibility rules in the public result. Repeated participation by a highly connected zone could influence the pooled estimate. Border topology can also change, and an observed link does not guarantee usable capacity at every interval.
Common causes are uncontrolled in the published statistic. Neighboring zones can share weather systems, demand patterns, generation fleets, and broader coupled-market conditions. The analysis is not a household bill study: it includes no retail tariff, household location mapping, flexible device, or counterfactual schedule. It is not peer reviewed, and it does not support a trading strategy or forecast guarantee.
Practical implication
For household alerting, a negative-price event in one market can be useful regional context, but it should not substitute for the household’s own bidding-zone price. The observed 58.47749065828621% co-occurrence is far from certainty and is measured at daily rather than actionable interval resolution. Controllers should wait for a valid local curve, apply the actual retail tariff, and reject stale or mismatched zone data.
For public explanations, “neighboring markets also saw negative prices that day” is supported when the underlying dates match. “The event crossed the border” requires additional flow and timing evidence. Preserving that wording difference prevents a descriptive network pattern from becoming a false physical story. No household should schedule a device or market transaction solely from the neighboring-zone result.
Reproducibility
A reproducer should verify the five hashes and enforce the 2026-08-30T00:00:00Z cutoff. It should document the zone-day negative-event rule, derive the border graph from the frozen source, and enumerate the exact 160 eligible neighbor-day units. The point estimate should reproduce at 58.47749065828621%, the interval should remain intentionally unreported, and the figure values should reproduce as 0.0%, 65.45130035696073%, and 96.46590058556774%.
The reproduction record should identify whether pairs are directed or undirected, how duplicate links are handled, how missing prices and border records affect eligibility, and what unit is resampled. An interval-level extension should be published as a new result rather than silently replacing the daily metric. It should include event overlap, lead-lag timing, flow direction, and capacity if it wishes to test physical propagation.
Research governance is linked through Voltcast’s Voltcast Research Content Plan. The exact assigned context sources are Electricity 2026 from the International Energy Agency, Rewarding flexibility: How retail contract choice can help unlock consumer flexibility from ACER and CEER, EU electricity trading in the day-ahead markets becomes more dynamic from the European Commission, and Single Day-ahead Coupling (SDAC) from ENTSO-E. They provide registered context, not unreported numerical evidence for propagation.
Disclosure
Analysis and drafting were model-assisted; sources, code, assumptions, and evidence hashes are disclosed. This public working paper has not been peer reviewed. It reports day-level co-occurrence and does not prove causal transmission or physical flow direction. It is not a household bill study, not a savings estimate, and not trading advice. No authors, credentials, source dates, digital object identifiers, or findings beyond the supplied evidence and registries were invented.
References
- International Energy Agency — Electricity 2026
- ACER and CEER — Rewarding flexibility: How retail contract choice can help unlock consumer flexibility
- European Commission — EU electricity trading in the day-ahead markets becomes more dynamic
- ENTSO-E — Single Day-ahead Coupling (SDAC)
- Voltcast — Voltcast Research Content Plan