Has the structure of negative pricing changed since 2015?
Has the structure of negative pricing changed since 2015. The long-run series establishes structural change but does not attribute it to one technology or rule.
Has the structure of negative pricing changed since 2015?
Abstract
This working paper uses the long-history wholesale record to ask whether annual negative-interval share is associated with calendar time. The evidence reports a “rank-free time association of annual negative-interval share” of Pearson r = 0.8537786708373213 across 12 covered years. The positive value indicates that later years in the analyzed annual series tended to have larger negative-interval shares. It does not identify which technology, market rule, demand pattern, or geographic change produced the association.
The central limitation is panel composition: zone coverage expands over time, and annual shares are unbalanced-panel summaries. A trend in the pooled series can therefore combine genuine within-zone change with changes in which zones are observed. The corrected evidence intentionally reports no bootstrap interval for the correlation estimand and now publishes exact machine-readable figure values for 2022 through 2026. The result supports a descriptive structural-change statement, not a causal attribution, household bill conclusion, future forecast, or trading recommendation.
Plain-language answer
Yes, the annual series shows a strong positive association between later calendar years and a greater share of negative-price intervals: Pearson r = 0.8537786708373213 over 12 years. In plain terms, the recorded annual summaries tended to rise with time.
That answer requires a major qualification. The set of covered zones expands over time, so the early and late annual summaries are not necessarily based on the same markets. A pooled upward pattern can reflect both changes within markets and changes in coverage. The evidence supports saying the observed structure changed in the assembled series. It does not support saying how much of that change occurred within a fixed European market panel or what caused it.
Research question
The primary question is: across the annual long-history summaries from 2015 through the 2026 cutoff, how strongly is calendar time linearly associated with the share of day-ahead intervals priced below zero? The registered statistic is Pearson correlation and the sample size is 12 covered years.
The question is about time association, not event mechanism. It does not test whether a specific market-coupling change, generation technology, tariff reform, or household behavior caused the annual pattern. It also does not ask whether episode duration, price depth, or geographic co-occurrence changed. Those dimensions may evolve differently and require separate preregistered metrics.
Data and provenance
The evidence declares long-history coverage from 2015-01-01 through 2026-08-29. It also lists daily prices from 2021-01-01 through 2026-08-29 and detailed intervals from 2025-10-01 through 2026-08-29. The primary result uses 12 covered years, consistent with the registered annual series over the long-history range. The final year is only represented through the stated cutoff, so it must not be silently treated as a complete calendar year.
The source-table contract lists day_ahead_prices, generation_mix, border_flows, risk_accuracy, and zone_holidays. The annual negative-interval share derives from day-ahead prices. The other tables define the research family and possible explanatory work, but the public result does not report a causal model using them. No assumptions are registered for this paper.
The current public-evidence JSON SHA-256 is f0e0a183ed9d59e21b6240bc110d03b36282a7aad703fb5b988d3ee320f43498. The analysis cutoff is 2026-08-30T00:00:00Z, and the latest declared data date is 2026-08-29. The query ran read-only with a 180-second statement timeout. Analysis-code SHA-256 is 57c57de79cdab2b5b6d6c54c485cb5162598c5ba0b0bfe995da40d75e6c52ba9; protocol SHA-256 is adb36bf6b447af9f96339249b8becaefc20422499cca1977242866347a97bd4b; registry SHA-256 is 7bcb91d7476d0a69fe9fa75a5c7782f8117e0153f82f9112b7e1d307d3943717; snapshot SHA-256 is 7e97489fc8528c8cc8c38830e05b48d949ce1f67b98575dff26f5d7c321e4c67; and source-registry SHA-256 is 07949550ac443ff673fda5c0209b99f137544f3ffecf6775f109bb9d09663bd6.
Method
For each covered year, the analysis summarizes the share of eligible day-ahead intervals priced below zero. It then computes Pearson correlation between calendar time and those annual shares. The evidence calls the measure rank-free because it uses the values directly rather than replacing them with ranks.
Pearson correlation captures linear association. A high positive value means later years tend to align with higher annual shares, but it does not prove monotonic increase in every year. It also does not yield a percentage-point increase per year; that would require a fitted slope and clear weighting. The JSON does not publish annual values or a slope, so neither is invented here.
The annual panel is unbalanced because zone coverage expands. A balanced-panel check would hold zone membership fixed across time, while an unbalanced summary uses the available coverage in each year. The registered result is the latter. The method family applies Holm control to inferential claims, while this result is descriptive and makes no unadjusted significance claim.
Results
The primary measured association is Pearson r = 0.8537786708373213, with a sample size of 12. The secondary result identifies 12 covered years. The positive correlation supports the evidence interpretation that the long-run series establishes structural change in the assembled annual summaries.
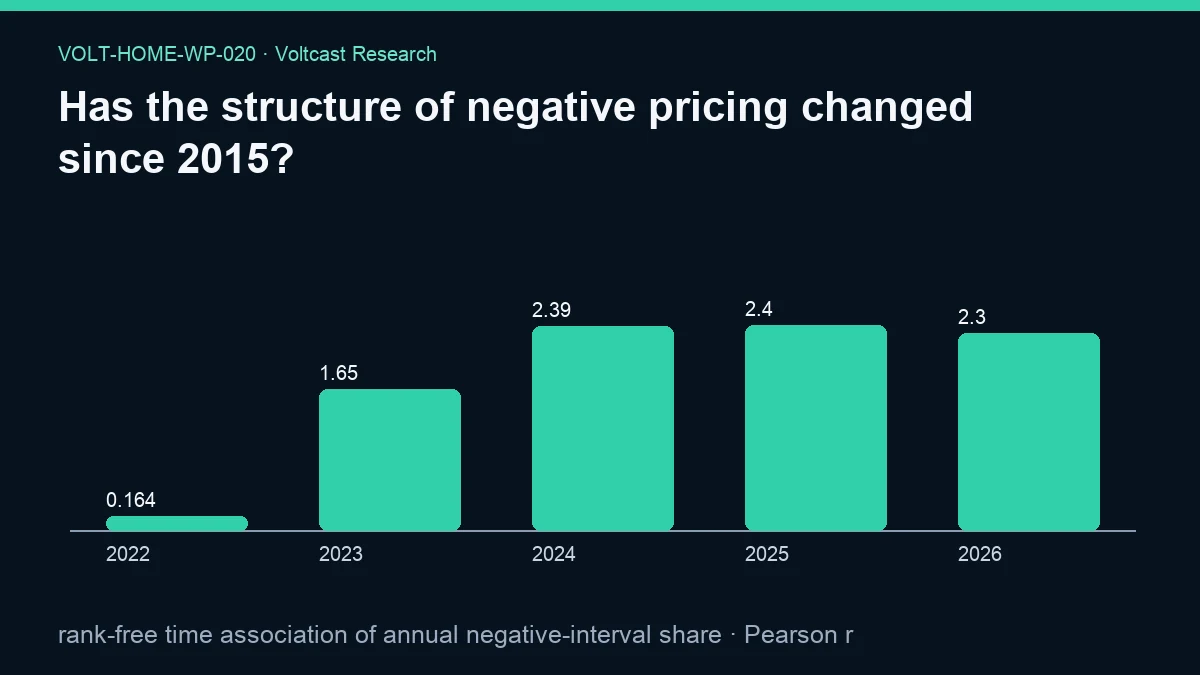
The figure now provides annual negative-interval-share values for five labelled years: 0.16397067910534366 for 2022, 1.6509905047207154 for 2023, 2.3892615143098137 for 2024, 2.4026391665980933 for 2025, and 2.3031116278610955 for 2026. These machine-readable values show that the final plotted year is below 2025, so the paper does not state that every successive year increased. Values for the other covered years are not exposed in the figure field.
The corrected evidence stores bootstrap_95_interval as null and identifies the interval method as “not reported for this estimand.” No confidence interval is claimed for the correlation. The five annual figure values are observed plot values, not sampling-uncertainty endpoints for r.
Robustness and placebo checks
The most important robustness comparison is a fixed-zone balanced panel. It would determine whether the positive association persists when every annual summary uses the same geographic coverage. Another check would leave one zone or year out, while a rank correlation could test whether the conclusion depends on the linear scale. No numerical outputs for these checks appear in the evidence.
The incomplete final year deserves separate treatment. A like-for-like comparison could use matched year-to-date windows for prior years or exclude the incomplete year under a preregistered rule. The public JSON does not say which adjustment, if any, is built into the annual shares. Reproduction must verify this rather than assume a full year.
The family Holm rule applies to inferential claims, but the current paper remains descriptive. The intentional null interval prevents unsupported interval interpretation. Any future uncertainty estimate should explicitly name the estimand and resampling unit before significance language is used.
Limitations
Expanding zone coverage is the primary limitation. An unbalanced panel can change its aggregate because new markets enter, even if existing markets do not change. The evidence does not publish a decomposition between within-zone trend and composition effect, so causal or Europe-wide fixed-panel claims are unavailable.
There are only 12 annual observations in the registered time association. Annual aggregation discards seasonality, event clustering, duration, and depth. The final covered year ends on 2026-08-29, and the evidence exposes figure values only for 2022 through 2026 rather than each annual value or weighting. Correlation uncertainty is intentionally not reported.
No explanatory variables are estimated. Changes in generation, demand, storage, network capacity, market design, fuel conditions, or bidding can coexist with the trend, but none is identified as the cause. The paper includes no retail tariffs or household counterfactuals and is not a household bill study. It is model-assisted, not peer reviewed, and not trading advice.
Practical implication
Home-energy products should not treat negative prices as a timeless rare-event regime calibrated from a fixed historical average. The positive time association suggests that frequency in the assembled annual series has changed, so alert baselines and user explanations should disclose their training window and refresh policy. This is a product-governance implication, not a claim that frequency will continue rising.
Controllers should still rely on a fresh local price curve and the household’s actual tariff. A long-run trend does not tell a device what to do tomorrow, and a pooled unbalanced series should not set an action threshold by itself. Transparent software can show recent climatology beside a forecast while preserving model lineage, issue time, and fallback behavior.
Reproducibility
A reproducer should validate the six SHA-256 identifiers, enforce the cutoff, and enumerate annual eligible intervals from 2015-01-01 through 2026-08-29. It should document annual weighting, native interval durations, revision handling, zone entry dates, and treatment of the incomplete final year. The annual time correlation should reproduce at 0.8537786708373213 over 12 covered years.
The reproduction package should publish both the registered unbalanced result and a clearly labeled balanced-panel diagnostic if licensing permits. It should preserve the intentional null interval and reproduce the five figure values exactly: 0.16397067910534366, 1.6509905047207154, 2.3892615143098137, 2.4026391665980933, and 2.3031116278610955 for 2022 through 2026. New causal attribution would require a separate protocol and evidence object.
The governance reference is Voltcast’s Voltcast Research Content Plan. Assigned context is linked through Electricity 2026 from the International Energy Agency, Rewarding flexibility: How retail contract choice can help unlock consumer flexibility from ACER and CEER, EU electricity trading in the day-ahead markets becomes more dynamic from the European Commission, and Single Day-ahead Coupling (SDAC) from ENTSO-E. No causal finding is attributed to those sources.
Disclosure
Analysis and drafting were model-assisted; sources, code, assumptions, and evidence hashes are disclosed. This public working paper has not been peer reviewed. Its unbalanced annual series establishes a descriptive time association, not a cause or forecast. It is not a household bill study and not trading advice. No authors, credentials, source dates, digital object identifiers, annual values, or external findings were invented.
References
- International Energy Agency — Electricity 2026
- ACER and CEER — Rewarding flexibility: How retail contract choice can help unlock consumer flexibility
- European Commission — EU electricity trading in the day-ahead markets becomes more dynamic
- ENTSO-E — Single Day-ahead Coupling (SDAC)
- Voltcast — Voltcast Research Content Plan