What is the price of a tighter indoor-comfort band?
What is the price of a tighter indoor-comfort band. Comfort has an explicit opportunity cost in the reduced-order scenario; no comfort preference is assumed optimal.
What is the price of a tighter indoor-comfort band?
Abstract
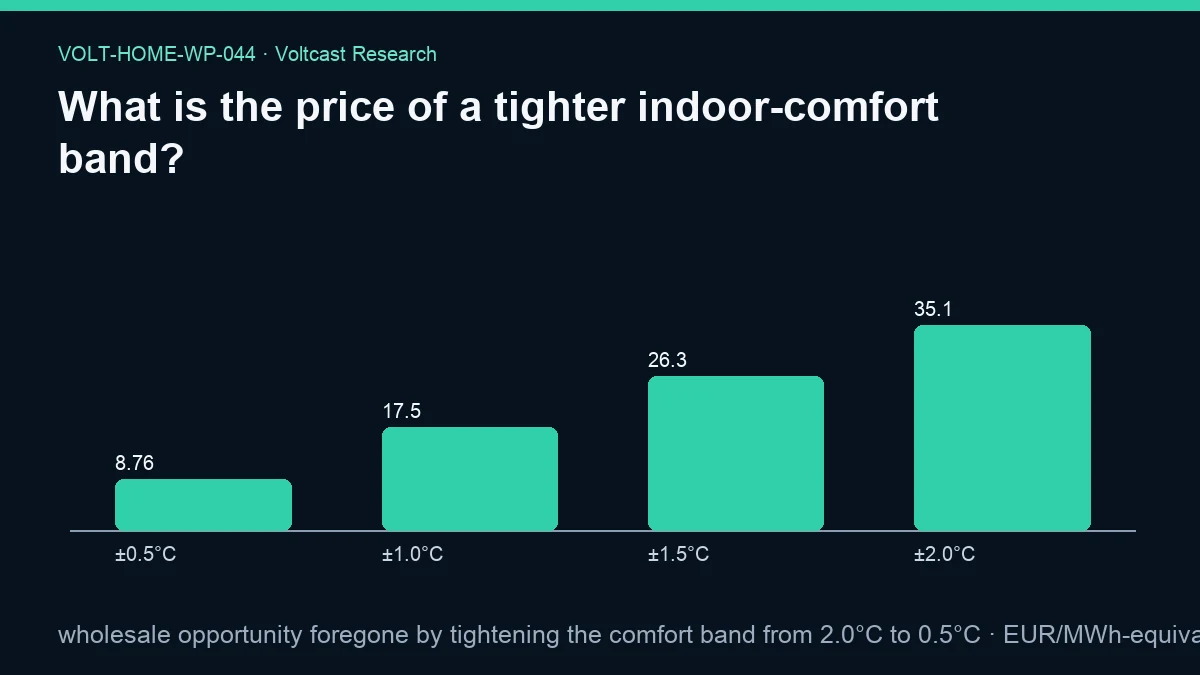
Price-aware heating is constrained by the indoor temperatures occupants are willing and able to accept. This working paper makes that constraint visible through a deliberately reduced-order sensitivity, not through a thermal simulation. Four declared symmetric comfort bands—±0.5°C, ±1.0°C, ±1.5°C, and ±2.0°C—scale the same observed mean daily day-ahead price range. Across 2,367 matched temperature-price observations, their wholesale opportunity signals are 8.762914, 17.525828, 26.288743, and 35.051657 EUR/MWh-equivalent. Tightening the declared band from ±2.0°C to ±0.5°C therefore forgoes 26.288742712294045 EUR/MWh-equivalent, the registered primary result. The number is an explicit opportunity-cost index, not the monetary value of comfort and not a claim that occupants should tolerate a wider range. No uncertainty interval is reported for this estimand. No comfort preference is assumed optimal. The reduced-order synthetic scenarios are not building simulations, customer telemetry, savings claims, or retail bills.
Plain-language answer
In this scenario, narrowing the permitted band from ±2.0°C to ±0.5°C reduces the wholesale opportunity index by 26.29 EUR/MWh-equivalent. A ±0.5°C band retains 8.76 of the index, while a ±2.0°C band retains 35.05. The two intermediate values are 17.53 at ±1.0°C and 26.29 at ±1.5°C.
Those figures do not put a euro price on anyone’s comfort. The calculation simply makes one trade-off explicit: a controller with less temperature latitude has fewer theoretical opportunities to move heating across price intervals. The Nordic cost–comfort study is assigned because it treats cost and comfort as separate objectives. The Energy and Buildings study provides context for thermal flexibility under different tariff designs. This paper’s values remain a transparent Voltcast sensitivity rather than imported findings from either study.
Research question
The registered question asks for the price of a tighter indoor-comfort band. We define “price” narrowly as wholesale opportunity foregone when the declared symmetric temperature latitude falls from ±2.0°C to ±0.5°C.
This definition does not monetise discomfort, health, sleep, productivity, or occupant preference. It also does not measure how much energy a building can store per degree. Instead, it maps a declared comfort-band width to a fraction of the observed daily wholesale price range. The paper asks whether the constraint is economically material at the screening stage while preserving the rule that comfort is not presumed available for sale.
Data and provenance
The evidence was frozen at publication cutoff 2026-08-30T00:00:00Z. It records daily price coverage from 2021-01-01 through 2026-08-29, detailed interval coverage from 2025-10-01 through 2026-08-29, and long-history coverage from 2015-01-01 through 2026-08-29. The registered family contract includes day_ahead_prices, zone_temp_weighted, zone_load, generation_mix, and forecasts.
The operative sample consists of 2,367 zone-days with both a daily day-ahead price summary and non-null population-weighted temperature context. The market input for each row is the daily maximum price minus the daily minimum price. Its mean is 350.51656949725395 EUR/MWh. No indoor-temperature series, thermostat setpoint, occupant survey, or building fabric measurement enters the calculation.
The analysis ran as a read-only transaction with a 180-second statement timeout. Reproduction identifiers are snapshot SHA-256 7e97489fc8528c8cc8c38830e05b48d949ce1f67b98575dff26f5d7c321e4c67, analysis-code SHA-256 57c57de79cdab2b5b6d6c54c485cb5162598c5ba0b0bfe995da40d75e6c52ba9, protocol SHA-256 adb36bf6b447af9f96339249b8becaefc20422499cca1977242866347a97bd4b, registry SHA-256 7bcb91d7476d0a69fe9fa75a5c7782f8117e0153f82f9112b7e1d307d3943717, and source-registry SHA-256 07949550ac443ff673fda5c0209b99f137544f3ffecf6775f109bb9d09663bd6. The evidence and figure hashes are 7c8a04991f90412017bce91ddbf98cb4c5476a33a315e87edbf01303d1cdc9b1 and 8f2366d606e74b4468ffc8340eb07803021260b78a5abc09d866bbe67a4b9103.
ACER and CEER and the registered European Commission communication place household flexibility in a retail-contract and policy context. The dynamic-tariff viability study provides assigned economic context. These sources do not supply the comfort-band coefficients or the primary result.
Method
For a comfort half-band (b) in degrees Celsius, the analysis defines a reduced-order opportunity signal as the observed mean daily price range multiplied by (b/20). The values of (b) are 0.5, 1.0, 1.5, and 2.0. The primary result is the ±2.0°C value minus the ±0.5°C value.
The divisor 20 is part of the frozen scenario specification. It is not a fitted heat-capacity parameter. Consequently, a one-degree increase in the half-band adds the same amount to the index. That linearity is a modelling assumption, whereas a real building’s heat storage, heat loss, and comfort response are nonlinear and path-dependent.
The preserved common assumptions are synthetic heat demand, no customer telemetry, COP sensitivity declared per paper, and wholesale energy only. No COP value is used here. The result therefore does not convert price exposure into electrical use or delivered heat for a device. Network charges, supplier margin, taxes, VAT, fixed charges, equipment losses, and retail contract terms are outside the calculation.
The regenerated evidence reports no uncertainty interval and names the interval method as “not reported for this estimand.” Because the primary difference is a deterministic transformation of the overall mean spread, this paper does not reconstruct uncertainty around 26.288743 from stale output. The work is descriptive, and no unadjusted significance claim is made; within-family Holm control remains the rule for inferential claims.
Results
The mean reduced-order opportunity is 8.76291423743135 EUR/MWh-equivalent at ±0.5°C, 17.5258284748627 at ±1.0°C, 26.28874271229405 at ±1.5°C, and 35.0516569497254 at ±2.0°C.
The primary contrast is 35.0516569497254 minus 8.76291423743135, which equals 26.288742712294045 EUR/MWh-equivalent. Because the scale is linear, the tightest band retains one quarter of the widest band’s index, and three quarters is foregone. That relationship follows from 0.5 divided by 2.0; it is not a measured behavioural elasticity.
The sample size is 2,367. The evidence stores no interval for the underlying daily price-range input or the primary contrast. The measured result shows that the declared comfort constraint materially changes the wholesale opportunity envelope. It does not show that a wider band improves welfare, because the analysis contains no valuation of comfort and no occupant outcome.
Robustness and placebo checks
The four-band grid is the primary sensitivity check. It reveals the entire frozen linear mapping instead of selecting only the largest contrast. The intermediate values sit exactly between the endpoints as the formula requires, which is a useful implementation check and also evidence of the model’s simplicity.
An algebraic zero-width placebo would produce zero opportunity. Equal start and end bands would produce a zero contrast. These implications verify the direction of the formula but are not empirical placebo experiments. The frozen evidence contains no randomized comfort settings, sham thermostat intervention, or matched untreated household.
No bootstrap interval is reported, so observed day-level price-range variation is not summarized as uncertainty here. The evidence also does not quantify uncertainty in thermal capacitance, heat loss, occupancy, or comfort preference. No causal statement is made, so no p-value is offered. Within-family Holm control is preserved for any later inferential work. A valid future robustness study would vary the band inside a building model or controlled household experiment while holding weather and service constant; that work has not been performed here.
Limitations
The largest limitation is that the comfort band is not connected to a thermal state equation. A ±2.0°C allowance in one building may store little useful heat and lose it quickly; in another, it may persist for hours. The same nominal band can also feel different across occupants, humidity, air speed, clothing, health conditions, rooms, and time of day.
Daily temperature and price summaries cannot reproduce a building-specific thermal state. The analysis does not know the starting room temperature, duration at a boundary, recovery rate, emitter temperature, or compressor capacity. It cannot distinguish preheating from simply overheating, and it does not value potential rebound peaks.
The opportunity index uses wholesale prices only. A household bill includes network and policy charges, taxes, supplier margin, and fixed components. The complete tariff can dampen or reverse the interval preference. The result should not be multiplied by heat demand or interpreted as annual savings.
The reduced-order synthetic scenarios are not building simulations, customer telemetry, savings claims, or retail bills. No comfort setting is recommended. Vulnerable occupants, landlord requirements, moisture control, medical needs, and equipment safety take priority over any price signal.
Practical implication
Comfort should be a hard, user-controlled input to automation, not a hidden default selected by an optimizer. A controller can show the marginal opportunity associated with widening a band, but the occupant must decide whether that latitude is acceptable. Separate day, night, room, and occupancy constraints may be more honest than one whole-home number.
The measured sensitivity also argues for reporting forgone opportunity rather than calling a tighter band a failure. A conservative choice can be rational even when it reduces the market envelope. Retail contract choice and enabling costs, as framed by the assigned ACER/CEER, European Commission, and Advances in Applied Energy sources, should be considered only after the safe comfort constraint is fixed.
Reproducibility
The canonical evidence file is /research-data/home-papers/what-is-the-price-of-a-tighter-indoor-comfort-band.json; the matching figure is /research-media/home-papers/what-is-the-price-of-a-tighter-indoor-comfort-band.webp. The evidence records the paper identity, assumptions, data windows, source tables, primary value, sample size, explicit null interval, disclosure, limitations, and provenance hashes.
To reproduce the result, join the frozen daily price summaries to non-null population-weighted zone temperatures by zone and day. Compute each daily range and its mean over the 2,367 matched observations. Multiply that mean by 0.5/20, 1.0/20, 1.5/20, and 2.0/20. Subtract the first value from the fourth. Preserve the cutoff, source selection, and hashes. A different band mapping or a physically calibrated thermal model would be a new analysis.
Data licensing and attribution are documented at /legal/data-licensing and Voltcast data licensing and redistribution. Reuse should retain both the wholesale-only limitation and the distinction between a declared comfort coefficient and measured occupant preference.
Disclosure
Analysis and drafting were model-assisted; sources, code, assumptions, and evidence hashes are disclosed. This working paper is not peer reviewed, makes no trading claim, and is not trading advice. Volt has no live traders or live capital. The paper does not provide medical, comfort, engineering, or equipment-control advice.
References
- Energy and Buildings. “Assessment of the thermal energy flexibility of residential buildings with heat pumps under various electric tariff designs.” https://doi.org/10.1016/j.enbuild.2023.113257
- Energies. “Exploring Cost–Comfort Trade-Off in Implicit Demand Response for Fully Electric Solar-Powered Nordic Households.” https://doi.org/10.3390/en18215568
- ACER and CEER. “Rewarding flexibility: How retail contract choice can help unlock consumer flexibility.” https://www.ceer.eu/wp-content/uploads/2025/11/ACER-CEER-2025-Retail-monitoring.pdf
- European Commission. “Communication from the Commission on the Citizens Energy Package.” https://eur-lex.europa.eu/legal-content/EN/TXT/?uri=CELEX%3A52026DC0115
- Advances in Applied Energy. “Assessing the conditions for economic viability of dynamic electricity retail tariffs for households.” https://doi.org/10.1016/j.adapen.2024.100174