How many negative-price intervals can a household actually use?
How many negative-price intervals can a household actually use. Technical availability materially limits how much of a negative-price episode a household can use.
How many negative-price intervals can a household actually use?
Abstract
An observed negative wholesale price is not automatically available to a flexible household device. This working paper applies one declared illustrative constraint: a flexible-load window from 09:00 to 17:00 local time. Within the registered sample of 651, the evidence reports that 86.4090169782817% of negative intervals fall inside that window. The corrected evidence intentionally reports no bootstrap interval for this estimand.
The time window is an assumption, not a measurement of actual household behavior. No household, tariff, electric vehicle connection, heat-pump state, battery state of charge, comfort preference, or device power is observed. The result therefore measures overlap between market intervals and a synthetic availability rule. It does not say a household can consume energy in every overlapping interval or realize the wholesale price. Detailed episode metrics use ten representative zones after 2025-10-01. This is a model-assisted, non-peer-reviewed working paper, not a household bill study and not trading advice.
Plain-language answer
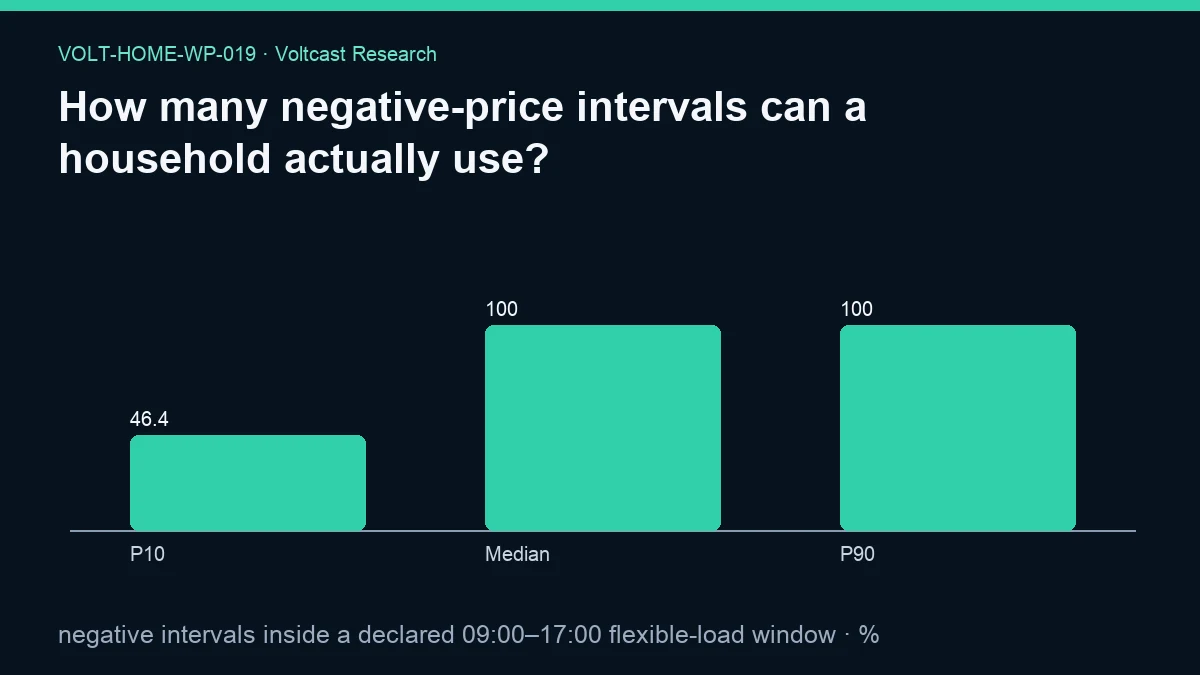
Under the paper’s illustrative rule, about 86.41% of the registered negative intervals were inside 09:00–17:00 local time, and the registered sample size is 651. The figure’s machine-readable P10, Median, and P90 values are 46.3768115942029%, 100.0%, and 100.0%. Those are plotted distribution summaries, not confidence limits around the 86.4090169782817% aggregate result.
The word “actually” in the title must be qualified. A real household can use an interval only if its device is available, has remaining energy or thermal capacity, can operate safely, and benefits under the retail tariff. This study knows none of those household facts. It uses a declared daytime window as a transparent scenario to show how availability assumptions narrow market opportunity. A different window could produce a different overlap and would require a separately identified result.
Research question
The primary research question is: what percentage of the observed negative day-ahead intervals in the registered detailed sample falls inside an illustrative 09:00–17:00 local-time flexible-load window? The numerator is eligible negative intervals within the declared window; the denominator is the study’s eligible negative-interval set.
This is not the broader optimization question “how much can a household save?” Savings would require the amount of flexible load, a counterfactual schedule, the household’s retail price for every interval, taxes and network charges, device efficiency, and operational limits. It also is not a survey of when households are available. The fixed window is explicitly registered as an assumption.
Data and provenance
The evidence declares daily prices from 2021-01-01 through 2026-08-29, detailed intervals from 2025-10-01 through 2026-08-29, and long-history coverage from 2015-01-01 through 2026-08-29. Its limitation says detailed episode metrics use ten representative zones after 2025-10-01. The 86.4090169782817% result should be interpreted within that detailed scope.
The source-table contract lists day_ahead_prices, generation_mix, border_flows, risk_accuracy, and zone_holidays. Day-ahead intervals and their local delivery times directly support this overlap calculation. The other tables identify the broader family contract but do not supply a measured household availability schedule. The sole registered assumption is: “The illustrative flexible-load window is 09:00–17:00 local time.”
The current public-evidence JSON SHA-256 is 5ce1f69b62fe71c2d1e9bba68eb33a295870f6086cd6686e381f3f36f84fdc8d. The publication cutoff is 2026-08-30T00:00:00Z. The analysis used a read-only transaction and a 180-second statement timeout. Analysis-code SHA-256 is 57c57de79cdab2b5b6d6c54c485cb5162598c5ba0b0bfe995da40d75e6c52ba9; protocol SHA-256 is adb36bf6b447af9f96339249b8becaefc20422499cca1977242866347a97bd4b; registry SHA-256 is 7bcb91d7476d0a69fe9fa75a5c7782f8117e0153f82f9112b7e1d307d3943717; snapshot SHA-256 is 7e97489fc8528c8cc8c38830e05b48d949ce1f67b98575dff26f5d7c321e4c67; and source-registry SHA-256 is 07949550ac443ff673fda5c0209b99f137544f3ffecf6775f109bb9d09663bd6.
Method
The analysis identifies native day-ahead delivery intervals with prices below zero, converts their timestamps to the appropriate local-time basis, and tests whether they lie inside the declared 09:00–17:00 window. It then calculates the percentage of eligible negative intervals inside the window. The evidence records 651 as the sample size.
Local-time classification is important. A fixed UTC rule would move relative to household clock time across zones and daylight-saving regimes. The evidence’s assumption explicitly uses local time, so a reproducer must use an unambiguous zone-aware conversion and correctly handle repeated or skipped civil times. Native interval duration should also be preserved when hourly and quarter-hourly periods coexist.
The method does not optimize device operation. It assumes a time window but no power limit, energy requirement, minimum runtime, state transition, efficiency, comfort constraint, or retail price pass-through. The family applies Holm control to inferential claims; this result is descriptive and makes no unadjusted significance claim. The corrected evidence intentionally leaves the bootstrap interval null for this estimand.
Results
The primary result is 86.4090169782817% of registered negative intervals inside the illustrative 09:00–17:00 local-time window. The sample size is 651. The evidence records bootstrap_95_interval as null and the interval method as “not reported for this estimand.” The figure separately reports 46.3768115942029%, 100.0%, and 100.0% at P10, Median, and P90.
This is an overlap rate, not an energy quantity. Equal interval counts can represent different energy opportunities if native intervals have different lengths or if a device has a varying power limit. The evidence’s metric name says “intervals,” so this paper does not relabel the percentage as a share of negative-price energy or financial value.
The result also does not prove that 86.4090169782817% is usable by any particular household. Time eligibility is necessary in the illustrative scenario but not sufficient. Device and tariff constraints can remove additional intervals. Conversely, households with overnight-connected devices or wider availability may have a different eligible set.
Robustness and placebo checks
The declared assumption is a strength for interpretability: readers can see exactly which synthetic window produced the result. Local-time rather than UTC classification is another important design choice. A replication should verify behavior at daylight-saving transitions and at the boundaries of 09:00 and 17:00.
Useful robustness checks would apply alternative preregistered windows, duration weighting, and zone-specific calculations. A placebo could shift the availability window while holding each day fixed, illustrating how much overlap arises from intraday event timing. The evidence JSON provides no numerical results for alternative windows or placebos, so this paper does not claim them.
No bootstrap interval is reported. This is an intentional uncertainty-handling choice because dependence among intervals in the same episode makes the resampling unit material. The within-family Holm statement governs inferential claims, while this paper retains a descriptive interpretation and treats the figure percentiles only as distribution summaries.
Limitations
The central limitation is that 09:00–17:00 local time is illustrative. It is not inferred from household telemetry or a device study. A household with an electric vehicle may be away during the window; a battery may be available continuously; a heat pump may be bounded by thermal comfort. Treating one window as universal would be a category error.
Detailed metrics cover ten representative zones after 2025-10-01. The evidence does not publish zone names, weights, event-level values, or the exact unit behind the sample size of 651. The metric counts intervals rather than measured flexible energy. Mixed market time units can also make count and duration shares differ.
No retail bill is modeled. Wholesale negativity may not survive supplier mark-ups, taxes, fixed fees, or network charges, and a device may face efficiency or degradation costs. The paper is therefore not a household bill study. It is model-assisted, not peer reviewed, and not a recommendation to automate a device, choose a tariff, buy hardware, or trade electricity.
Practical implication
Home-energy software should ask for actual availability and device constraints rather than assume that every negative interval is useful. The illustrative result shows that even a simple declared window changes the eligible set. A production controller should then apply energy capacity, power, comfort, deadline, retail price, and safety constraints before scheduling.
Interfaces should label scenario assumptions prominently. “Inside your configured flexible window” is more accurate than “you can use this price.” The schedule should preserve native intervals and local timezone, disclose stale data, and provide a safe fallback. This study does not choose a device policy or estimate savings; it demonstrates why opportunity and usability are different concepts.
Reproducibility
A reproduction should verify the hashes and cutoff, select the protocol-defined detailed sample, and preserve native interval timestamps. It should map each interval to the correct bidding-zone local time, apply the 09:00–17:00 rule exactly, document whether endpoints are inclusive, and reproduce a sample size of 651 and an inside-window percentage of 86.4090169782817.
The reproduction should preserve the intentionally null interval and reproduce figure values 46.3768115942029%, 100.0%, and 100.0% for P10, Median, and P90. A duration-weighted companion result should be labeled separately because it changes the estimand. Any alternative household window, tariff, or device model is a new assumption and must not be blended into this measured scenario.
The public governance reference is Voltcast’s Voltcast Research Content Plan. Exact assigned context is linked through Electricity 2026 from the International Energy Agency, Rewarding flexibility: How retail contract choice can help unlock consumer flexibility from ACER and CEER, EU electricity trading in the day-ahead markets becomes more dynamic from the European Commission, and Single Day-ahead Coupling (SDAC) from ENTSO-E. No unreported household finding is attributed to them.
Disclosure
Analysis and drafting were model-assisted; sources, code, assumptions, and evidence hashes are disclosed. The 09:00–17:00 local-time window is an illustrative assumption, not measured household behavior. This working paper is not peer reviewed, is not a household bill study, and does not estimate realizable savings. It is not trading advice and recommends no transaction, tariff, or device. No authors, credentials, dates, digital object identifiers, or findings were invented.
References
- International Energy Agency — Electricity 2026
- ACER and CEER — Rewarding flexibility: How retail contract choice can help unlock consumer flexibility
- European Commission — EU electricity trading in the day-ahead markets becomes more dynamic
- ENTSO-E — Single Day-ahead Coupling (SDAC)
- Voltcast — Voltcast Research Content Plan