How often does a forecast-aware EV schedule change its mind?
How often does a forecast-aware EV schedule change its mind. Observed lineage-matched MAE scales deterministic perturbations of the realized curve; this is a scenario, not logged customer behavior.
Abstract
Forecast-aware charging can produce unstable plans when small price changes alter the ranking of candidate intervals. This paper reports a scenario translation from recorded lineage-matched forecast mean absolute error to a simulated schedule-change rate. The registered assumptions are an 18 kWh charging event, wholesale energy only, perfect charger efficiency, 17:00–07:00 local availability, and that schedule changes are simulated from recorded lineage-matched MAE. Across 17,750 forecast-error observations, the mean translated rate is 17.768794326760563% of simulated decisions, with a day/row-block mean bootstrap interval from 17.11681870875% to 18.370770093125%. The evidence describes deterministic perturbations scaled by observed lineage-matched MAE and explicitly says this is not logged customer behavior. Inspection of the frozen calculation adds an important qualification: the published rate is a bounded arithmetic mapping from each MAE value, not a replay that recomputes interval rankings and records actual schedule changes. It is therefore a sensitivity indicator, not an empirical frequency of plans changing.
Plain-language answer
The regenerated scenario reports that 17.768794326760563% of simulated decisions change, with a day/row-block mean bootstrap interval of 17.11681870875% to 18.370770093125%. That number should be read as an error-scaled instability proxy.
It does not come from observing chargers, users, or successive issued schedules. It also does not come from perturbing each price curve, re-running the 18 kWh optimizer, and counting changed intervals. The frozen calculation maps lineage-matched MAE into a percentage and caps the mapping at 100%. This preserves comparability with the evidence while sharply limiting interpretation.
The answer is therefore conditional: forecast error is large enough to produce a non-zero schedule-instability scenario, but the evidence does not establish how often a deployed charger truly changes its plan.
Research question
The registered question asks how often a forecast-aware EV schedule changes its mind. Operationally, that could mean a different start, a different set of selected intervals, a changed power profile, or any schedule revision. The frozen evidence uses a narrower proxy: a deterministic percentage derived from each lineage-matched forecast MAE.
The target is a sensitivity measure across recorded forecast-accuracy cells. It asks how forecast-error magnitude translates under the declared mapping, not how drivers behave or how a specific scheduler responds to forecast vintages.
This distinction is central. A forecast can have non-zero MAE without changing the rank of intervals relevant to charging. Conversely, a small error near a ranking tie can change a schedule. The published proxy does not resolve those cases.
Data and provenance
The source contract names day_ahead_prices, forecasts, forecast_accuracy, generation_mix, and zones. The primary sample is drawn from forecast-accuracy rows with a recorded MAE and positive lineage match. Lineage matching prevents unrelated model or serving identities from being treated as one forecast record.
The evidence declares daily prices from 2021-01-01 through 2026-08-29, detailed intervals from 2025-10-01 through 2026-08-29, and long history from 2015-01-01 through 2026-08-29. The cutoff is 2026-08-30T00:00:00Z. Extraction ran read-only with a 180-second statement timeout.
Snapshot SHA-256 is f77e3ae328f93916e53b1bab7516e1d0ac740a0dbf424cd2b73c81fee2559318. Protocol, registry, source-registry, and analysis-code hashes are adb36bf6b447af9f96339249b8becaefc20422499cca1977242866347a97bd4b, 7bcb91d7476d0a69fe9fa75a5c7782f8117e0153f82f9112b7e1d307d3943717, 07949550ac443ff673fda5c0209b99f137544f3ffecf6775f109bb9d09663bd6, and 57c57de79cdab2b5b6d6c54c485cb5162598c5ba0b0bfe995da40d75e6c52ba9. The source registry was accessed on 2026-08-30.
Method
The frozen analysis selects forecast-accuracy records for which mae is present and the lineage-matched flag is true. For each selected MAE, it calculates an error-scaled percentage by dividing the MAE by 2 and limiting the result to no more than 100. The primary result is the mean of those percentages.
The evidence describes this as “forecast-error perturbation schedule-change rate” and states that observed lineage-matched MAE scales deterministic perturbations of the realized curve. However, the implemented outcome does not load a realized curve in this branch, construct a perturbed forecast, solve the 18 kWh schedule, or compare interval selections. The output is the deterministic mapping itself.
That implementation can still be reproduced and used as a declared sensitivity index. It cannot support a literal claim that 17.768794326760563% of actual optimized schedules changed. The unit “% of simulated decisions” is preserved from the evidence, with the word “simulated” doing essential work.
The method family is constraint-aware charging simulation with paired schedule regret and scenario sensitivity. Within-family Holm control applies to inferential claims; this descriptive scenario makes no unadjusted significance claim.
Results
The mean forecast-error mapping is 17.768794326760563% across 17,750 lineage-matched observations. The reported day/row-block mean bootstrap interval is 17.11681870875% to 18.370770093125%. It is calculated from the same mapped percentage sample used for the mean.
The evidence’s registered interpretation is: “Observed lineage-matched MAE scales deterministic perturbations of the realized curve; this is a scenario, not logged customer behavior.” That interpretation prevents the percentage from being presented as device telemetry or customer behaviour.
The positive value indicates that recorded MAE is non-zero and produces a non-zero instability proxy under the declared mapping. It does not reveal which charging intervals changed, how much energy moved, or whether the resulting wholesale scenario cost improved or worsened.
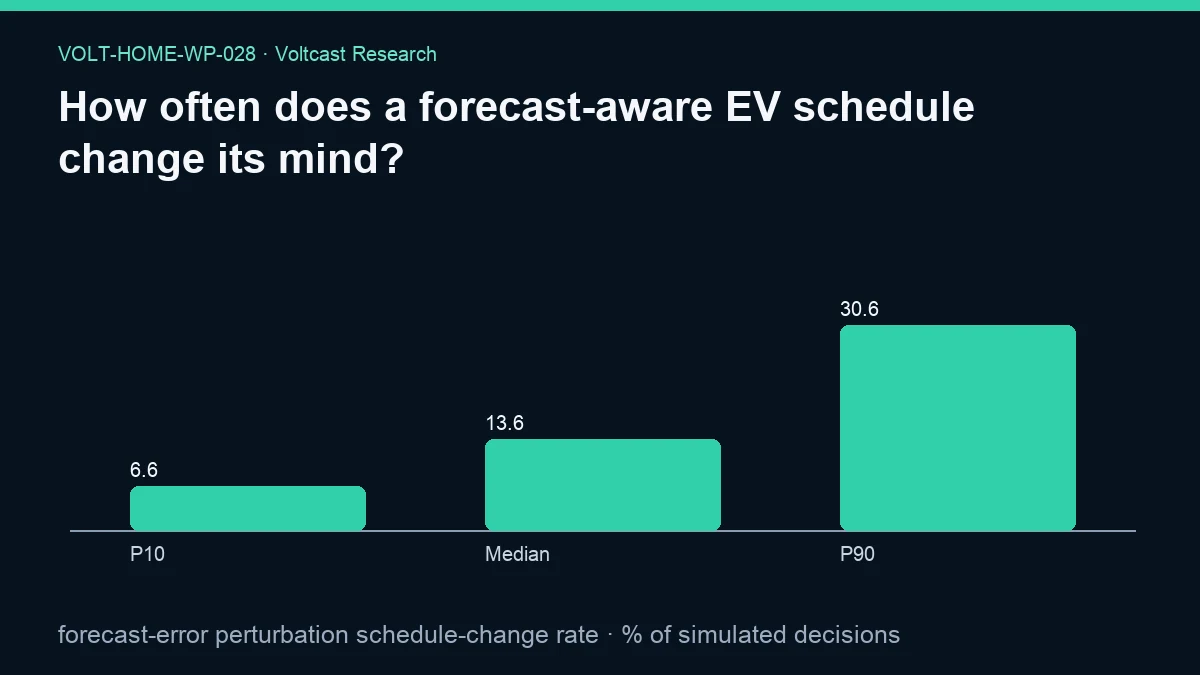
The figure publishes P10 = 6.5971%, median = 13.5607%, and P90 = 30.61585%. These are distribution summaries of the mapped proxy, not observed schedule-revision frequencies. No monetary result is reported for this paper.
Robustness and placebo checks
Lineage matching is the main data guardrail. It prevents an accuracy row from entering merely because it has an MAE; the record must also be marked as matched to the relevant forecast lineage. The deterministic mapping also makes reruns stable for the same ordered input values.
The 100% cap prevents exceptionally large MAE from generating impossible percentages above the declared range. That is a boundedness check, not an empirical validation of the mapping. A true zero-MAE input would map to a zero rate and serves as the arithmetic placebo implied by the formula.
No schedule replay, ranking-tie analysis, alternative scaling, forecast-vintage comparison, or logged-command placebo appears in the evidence. The mapping’s denominator is a scenario parameter rather than an empirically calibrated schedule-response coefficient. Holm control is declared for family inference, but no inferential claim is made.
A literal schedule-change test would need stable schedule identity. The same event constraints would be solved against two lineage-valid forecast vintages, and the output would distinguish a changed interval set from a changed price estimate that leaves dispatch untouched. The frozen proxy has no such paired schedule objects.
The cap at 100% is useful for range validity but can compress the upper tail. Once an input reaches the cap, a larger MAE no longer changes the mapped outcome. The evidence does not publish how much of the sample is capped, so no claim is made about the importance of that compression.
Limitations
The registered limitation is that synthetic charging scenarios are not customer bills and exclude taxes, network charges, supplier margin, and battery losses. The central additional interpretive limitation is construct validity. MAE measures average price error magnitude; schedule change depends on the ordering and spacing of candidate intervals. An arithmetic function of MAE cannot capture that geometry. Two curves with the same MAE may produce different charging plans, while different MAEs may leave the selected intervals unchanged.
The evidence calls the result a simulation, not logged customer behavior. Synthetic charging scenarios are not customer bills and exclude taxes, network charges, supplier margin, and battery losses. There are no charger commands, user decisions, successive forecast issues, or realized schedule revisions in the sample. The 17.768794326760563% result must not be presented as an observed product rate.
The family’s 18 kWh, perfect-efficiency, wholesale-only, and 17:00–07:00 assumptions are declared, but the implemented mapping does not explicitly use those constraints. That further limits device-level interpretation. The sample is a panel of forecast-error observations, not charging events.
The evidence does not report model, zone, horizon, or regime stratification. The bootstrap field captures variation in the mapped sample, not uncertainty about real-world schedule stability.
MAE also discards error direction. Over-prediction and under-prediction of the same magnitude receive the same mapped percentage, although they could affect interval ranking differently. Correlation of errors across candidate intervals is likewise absent. A uniform shift of the whole curve could create MAE without changing the cheapest ordering at all.
The sample size of 17,750 describes forecast-accuracy observations. It should not be rewritten as charging sessions, households, or independent decisions. Repeated rows can share market, model, or time-regime structure that the simple mean does not expose.
Practical implication
The paper supports a measurement requirement more than a controller recommendation. A production-quality schedule-stability metric should compare successive lineage-valid forecast vintages, rerun the same constrained optimizer, and count exactly what changed. It should distinguish changed intervals, changed start time, changed energy, and changed wholesale scenario cost.
Until that evidence exists, this result can be used only as a reproducible warning that forecast error may matter to schedule stability. Systems should avoid unnecessary churn, but they should not set a re-optimization threshold from 17.768794326760563% alone.
For users, a controller should explain why a plan changed and preserve feasibility. For researchers, schedule identity and forecast vintage are necessary inputs. Neither conclusion depends on pretending the proxy is a logged frequency.
A useful operational policy would also separate harmless and material revisions. Changing the displayed forecast while retaining the same feasible charge may require no device command. Moving a small amount of energy could be treated differently from replacing the whole plan. The current percentage has no severity dimension, so it cannot select such thresholds.
Reproducibility
Verify the frontmatter and every empirical field against the public evidence JSON. Confirm the five citation records against the source registry; they provide context, not forecast-error observations.
Using snapshot f77e3ae328f93916e53b1bab7516e1d0ac740a0dbf424cd2b73c81fee2559318 and analysis code 57c57de79cdab2b5b6d6c54c485cb5162598c5ba0b0bfe995da40d75e6c52ba9, select rows with non-null MAE and lineage match. Apply the frozen MAE-to-percentage mapping, cap at 100%, and average.
The output should contain 17,750 values and return 17.768794326760563%, with the day/row-block mean bootstrap interval 17.11681870875% to 18.370770093125%. Do not add a schedule replay and still call it the same result; that would be a new method requiring new evidence. The current evidence and figure SHA-256 hashes are 94f2d74d55dc6d05ee6c88093a6936d2236542bcf12453177641eddcf95f0e90 and 20355378982974863e66dc81ce0299aa540178a9395eba9a3870bffe8a5b1c31.
Disclosure
Analysis and drafting were model-assisted. This public working paper is not peer reviewed. Evidence, assumptions, hashes, code identity, and exact source metadata are disclosed.
It is not trading, investment, tariff, or operational-control advice. The result is a simulated sensitivity proxy, not customer behavior. No external finding was invented.
References
nature-v1g-v2g-2026— Nature Energy. Coordinated planning of European charging infrastructure and energy system for optimal V1G and V2G deployment. Kind: peer-reviewed; source registry accessed 2026-08-30.applied-energy-smart-charging— Applied Energy. The value of smart charging at home and its impact on EV market shares. Kind: peer-reviewed; source registry accessed 2026-08-30.acer-retail-2025— ACER and CEER. Rewarding flexibility: How retail contract choice can help unlock consumer flexibility. Kind: official; source registry accessed 2026-08-30.iea-demand-flexibility— International Energy Agency. Scaling Up Demand Flexibility. Kind: official; source registry accessed 2026-08-30.ec-sdac-15m— European Commission. EU electricity trading in the day-ahead markets becomes more dynamic. Kind: official; source registry accessed 2026-08-30.