How renewable generation changes day-ahead forecast error
How renewable generation changes day-ahead forecast error. This regime relationship is observational and does not assign model-error causality.
Abstract
Day-ahead price forecast error has a weak positive association with the daily low-carbon generation share in the frozen serving record. The Pearson correlation between lineage-matched MAE and the generation-share measure is 0.08533585137060837 across 17,134 paired observations. The sign means higher low-carbon share coincides with slightly higher absolute forecast error on average, but the magnitude is small and the design is observational.
The implemented driver is broader than renewable generation alone. It is a daily share formed from the analysis code's declared low-carbon production categories. The public aggregate does not separate wind, solar, hydro, nuclear, or other included categories for this outcome, and it does not allocate imports. The result therefore cannot be described as a causal renewable effect. Serving lineage ensures the error belongs to the model actually selected for service for that zone, date, and horizon; it does not remove confounding from weather, demand, outages, cross-border constraints, model version, or market regime.
Plain-language answer
The measured relationship is positive but weak: the correlation is 0.08533585137060837. Days with a higher recorded low-carbon generation share tend to have slightly higher serving-model MAE, but the relationship is far too limited to say that renewable generation causes forecast errors.
This may reflect many overlapping processes. Variable output can reshape intraday prices, but low-carbon-heavy days can also differ in season, demand, interconnector use, outages, and price volatility. The metric combines low-carbon technologies rather than isolating wind and solar. The practical answer is not “renewables make forecasts worse.” It is “generation regime contains a small amount of descriptive information about error, and a causal explanation needs a more controlled design.”
Research question
The title asks how renewable generation changes forecast error. A causal answer would require a credible counterfactual for what the same market day would have looked like under a different renewable-output level, while holding weather, demand, capacities, fuel prices, and model information constant. This paper does not have that counterfactual.
The implemented question is whether lineage-matched MAE co-moves with a daily low-carbon generation share. It uses Pearson correlation over paired zone-date records. ENTSO-E's Single Day-ahead Coupling (SDAC) describes a market in which cross-border capacity and coupled auctions jointly affect prices. That context makes single-driver attribution especially unsafe: a local generation share and local price error can both respond to wider system conditions.
Data and provenance
The public evidence JSON in the frontmatter is frozen at 2026-08-30T00:00:00Z. The declared contracts are forecast_accuracy, forecast_serving_lineage, risk_accuracy, generation_mix, and zone_temp_weighted. This outcome joins lineage-matched forecast MAE to a daily generation mix by zone code and date. Negative generation values are floored before shares are formed, and only records with a finite share enter the pair set.
The snapshot was extracted SELECT-only under a read-only transaction and 180-second statement timeout. Its SHA-256 is f77e3ae328f93916e53b1bab7516e1d0ac740a0dbf424cd2b73c81fee2559318. The analysis-code hash is 57c57de79cdab2b5b6d6c54c485cb5162598c5ba0b0bfe995da40d75e6c52ba9; protocol hash adb36bf6b447af9f96339249b8becaefc20422499cca1977242866347a97bd4b; registry hash 7bcb91d7476d0a69fe9fa75a5c7782f8117e0153f82f9112b7e1d307d3943717; and source-registry hash 07949550ac443ff673fda5c0209b99f137544f3ffecf6775f109bb9d09663bd6. The evidence and figure hashes are fae2619cb0f9a4a9d3de8b6aab6d820aa43c4ea5519a6843ca575bca8003a1d0 and d963b13b919f317366ee15cef4124a2c36cc5cce57f338098f1bb3d0db809d02. The source registry was accessed on 2026-08-30, and the evidence registers no paper-specific assumptions.
Method
The analysis starts with accuracy rows that have non-null MAE and an exact immutable serving-lineage match on zone, delivery date, horizon bucket, and model version. It aggregates generation by zone, UTC date, and production category, calculates the sum of included low-carbon categories divided by all nonnegative recorded generation, and pairs that share with MAE on the same zone-date key. Pearson correlation is then calculated across the finite pairs.
The method does not weight technologies by emissions, forecast uncertainty, or marginal price impact. Nor does it distinguish exact horizons in the correlation. The Objective-specific seven-day forecast promotion remains binding: a model's point, quantile, external-benchmark, and customer-serving objectives cannot be pooled as one champion identity. The failed, non-serving programme documented in the Volt 6.1 cross-zone price model card is excluded from live-service evidence even though it contains cross-zone model architecture.
Results
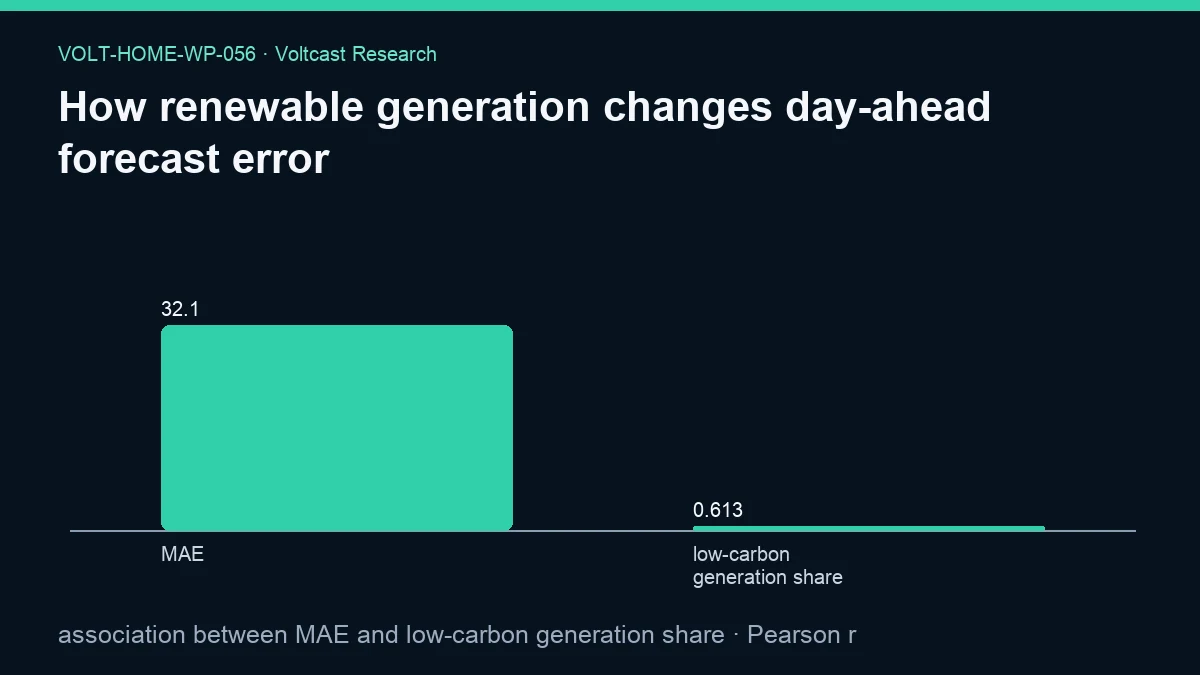
The measured Pearson correlation is 0.08533585137060837 across 17,134 paired observations. Positive correlation means higher low-carbon generation share is associated with higher MAE in the pooled sample. The figure records MAE = 32.14102987626941 EUR/MWh and low-carbon generation share = 0.6126771395975935 for scale; those marginal means are not the correlation. The coefficient is close enough to zero that the generation share explains little of the row-level variation by itself.
The evidence’s registered interpretation is: “This regime relationship is observational and does not assign model-error causality.” That boundary applies even though the title uses the word “changes.”
The regenerated evidence records bootstrap_95_interval as null and the interval method as “not reported for this estimand.” No uncertainty interval accompanies 0.08533585137060837, and this paper makes no significance claim.
No technology-specific coefficient, causal effect, zone ranking, or horizon interaction is reported. Those quantities are not inferred from the figure or from unrelated evidence files.
Robustness and placebo checks
Serving-lineage matching is the core robustness control. It prevents a researcher from replacing the historical serving model with a development version after observing a generation regime. The same zone-date key also prevents pairing an error with generation from another date.
The evidence does not include the placebos required for causal interpretation. There is no within-zone demeaning, season control, demand control, lagged-generation placebo, shuffled-date test, technology split, or matched weather regime. UTC-date generation is paired with a forecast record date; local-date seam effects are not audited in the public aggregate. No blocked uncertainty interval is reported. Within-family Holm adjustment is not used because no inferential claim is made.
A further robustness concern is repeated use of one generation-day summary. Several exact-horizon accuracy cells can share the same zone-date driver, so treating every pair as independent would overstate effective information. A date-clustered or zone-date-clustered analysis should recompute the association after collapsing or weighting those duplicates. It should also compare the observed coefficient with a date-permutation placebo performed within zone and season. Those checks are proposed methods only; the frozen JSON contains no such outcomes.
Limitations
The evidence’s registered limitation is that only rows matched to immutable serving lineage are treated as live-service evidence. Within that valid sample, the driver is called low-carbon share, not renewable share. Treating the two as synonyms would overstate what was measured. The included categories can have different predictability and price effects, while omitted imports can alter the local supply picture. Daily averaging also discards the quarter-hour alignment between renewable output and price error.
Pearson correlation is sensitive to pooling and does not account for nested observations. Repeated rows can share a zone-date across different horizons. Zones differ in price scale, generation reporting completeness, and serving models. A pooled positive association can differ from within-zone associations, including a possible reversal.
The outcome cannot distinguish whether difficult generation regimes challenge the model or whether difficult price regimes happen to coincide with a particular mix. It also does not compare a weather-aware model with an otherwise identical model without renewable features. Causal language is therefore prohibited.
Coverage of generation categories can vary over time and by reporting area. A ratio built from the categories present in one zone-date may not be compositionally identical to a ratio in another. The public evidence does not publish completeness thresholds, revisions, or source-age fields for each paired generation day. It therefore cannot establish that measurement quality is unrelated to forecast error. This matters because missing or delayed generation categories could affect both the calculated share and the market-data context available for later model evaluation.
Finally, daily low-carbon share is not the same as forecast renewable uncertainty. Realized production may be high and accurately anticipated, or modest and badly anticipated. A direct model-mechanism study would compare issue-time renewable forecasts, their revisions, and the price model's response under one frozen version. The current outcome has no such decomposition.
Practical implication
Generation mix can be used as a monitoring stratum. Operators should report forecast error by generation regime to detect whether reliability degrades on low-carbon-heavy days. But the weak pooled correlation is not a reason to suppress renewable forecasts, change a household schedule, or claim a technology causes price uncertainty.
For home users, the local forecast's exact horizon, issue time, and calibration remain more actionable than a fleet-level generation correlation. For model governance, any regime-specific challenger must beat the serving model prospectively under the same objective. The Voltcast Research Content Plan requires the observational boundary and the small result to remain explicit rather than converting them into a dramatic causal headline.
Reproducibility
Verify the evidence and manifest hash, followed by the snapshot, code, protocol, and registry hashes. Join accuracy to immutable serving lineage on zone, date, horizon bucket, and exact version. Aggregate generation by zone, date, and category; floor negative values; sum the declared low-carbon categories; divide by total recorded generation; retain finite zone-date pairs; and calculate Pearson correlation between share and MAE.
A stronger follow-up should preregister technology-specific shares, local-time alignment, within-zone and within-horizon effects, common-date panels, demand and season controls, lag placebos, and blocked date resampling. It must publish as new evidence rather than alter this frozen correlation. Google Search Central's assigned Article structured data source supports machine-readable article identity. It is not evidence for the generation association.
Disclosure
Analysis and drafting were model-assisted. The language model explained a frozen correlation and preserved the distinction between low-carbon share and renewable causality. It supplied no empirical number. Sources, assumptions, limitations, code, and hashes are disclosed. This working paper is not peer reviewed.
Volt has zero live traders and zero live capital. C0R is the only paper strategy. Production forecasting is a non-trading service. This observational result is not trading advice, financial advice, a household-savings estimate, or authorization to promote a model.
References
volt-promotion-policy— Voltcast. Objective-specific seven-day forecast promotion. Kind: canonical; registered URL:/docs/voltcast/OBJECTIVE-PROMOTION-POLICY.md; source registry accessed 2026-08-30.volt-v61-card— Voltcast. Volt 6.1 cross-zone price model card. Kind: canonical; registered URL:/docs/voltcast/V6.1-MODEL-CARD.md; source registry accessed 2026-08-30.volt-research-content— Voltcast. Voltcast Research Content Plan. Kind: canonical; registered URL:/docs/voltcast/RESEARCH-CONTENT-PLAN.md; source registry accessed 2026-08-30.google-article— Google Search Central. Article structured data. Kind: official; source registry accessed 2026-08-30.entsoe-sdac— ENTSO-E. Single Day-ahead Coupling (SDAC). Kind: official; source registry accessed 2026-08-30.