How temperature extremes change electricity-price forecast error
How temperature extremes change electricity-price forecast error. This regime relationship is observational and does not assign model-error causality.
Abstract
Temperature extremity has a weak negative association with serving-lineage-matched day-ahead price forecast error in the frozen evidence. The Pearson correlation between MAE and absolute distance from the pooled median daily temperature is -0.0907959211562267 across 17750 paired observations. The result runs against a simple expectation that more extreme temperatures must always make prices harder to forecast.
The association is descriptive and small. The temperature input is the daily average temp_best_c for a zone-date, and “extreme” is defined relative to the pooled median of available paired temperatures, not to a zone-specific climatology or a meteorological warning threshold. The design does not separate hot and cold conditions, account for season and zone, or identify heat-driven demand causally. Exact serving lineage protects the forecast-error side from hindsight model selection, but it does not eliminate confounding. This model-assisted working paper is not peer reviewed.
Plain-language answer
In this pooled record, more temperature-extreme days are associated with slightly lower, not higher, absolute price forecast error. The measured correlation is -0.0907959211562267. Because the value is weak and observational, it should not be translated into “extreme weather makes prices easier.”
One plausible structural reading is simply that extremity alone is not the main difficulty measure. A well-forecast cold spell can create a large but predictable demand response, while an ordinary-temperature day can contain outages, fuel shocks, or congestion that a price model misses. The evidence does not test those explanations. It establishes that a pooled monotonic “more extreme temperature, more MAE” claim is not supported by this measurement.
Research question
The title asks how temperature extremes change electricity-price forecast error. A causal design would need to compare otherwise similar market states under different temperature shocks, with zone-specific climatology, season, demand, generation, outages, and cross-border conditions controlled. It would also need to distinguish forecast temperature from realized temperature and preserve the information available at issue time.
The implemented question is narrower: does lineage-matched MAE correlate with the absolute distance of observed daily zone temperature from the median temperature in the paired sample? The result is a pooled Pearson correlation. ENTSO-E's Single Day-ahead Coupling (SDAC) supplies context that local prices are formed within a coupled cross-zonal process. Temperature can matter for demand, but coupled capacity and wider system conditions mean local temperature is not a complete price driver.
Data and provenance
The evidence JSON named in the frontmatter is frozen at 2026-08-30T00:00:00Z. The family contracts are forecast_accuracy, forecast_serving_lineage, risk_accuracy, generation_mix, and zone_temp_weighted. This result uses non-null MAE from exact lineage matches and pairs it by zone code and date with finite temp_best_c from the daily temperature aggregate.
The production snapshot was extracted SELECT-only under a read-only transaction and a 180-second statement timeout. Its SHA-256 is 7e97489fc8528c8cc8c38830e05b48d949ce1f67b98575dff26f5d7c321e4c67. The analysis-code hash is 57c57de79cdab2b5b6d6c54c485cb5162598c5ba0b0bfe995da40d75e6c52ba9; protocol hash adb36bf6b447af9f96339249b8becaefc20422499cca1977242866347a97bd4b; registry hash 7bcb91d7476d0a69fe9fa75a5c7782f8117e0153f82f9112b7e1d307d3943717; and source-registry hash 07949550ac443ff673fda5c0209b99f137544f3ffecf6775f109bb9d09663bd6. The evidence and figure hashes are 0150f1b229d93ca6af3b6ea5904a91a45030a6d4bbc3487f807b27a6e40c2a52 and 638ab046ea0e05681f6ec711012a53fbc62988e8bb9fa058318d7c009ff68c42. Only paper-level aggregates are published.
Method
Eligible forecast rows require non-null MAE and an immutable serving-lineage match on zone, delivery date, horizon bucket, and exact model version. Temperature observations are averaged by zone and UTC date in the public-safe snapshot. The analysis pairs each eligible error row to the matching zone-date temperature, calculates the median over all paired temperature values, transforms each temperature into its absolute distance from that median, and calculates Pearson correlation with MAE.
This extremity measure is rank-like in spirit but not climatological. It uses one pooled center and preserves the temperature unit in the transformed variable. The model objective remains part of the identity. Under Objective-specific seven-day forecast promotion, point, quantile, external-challenger, and customer-serving evidence cannot substitute for one another. The development architecture in the Volt 6.1 cross-zone price model card failed its gate and never served, so it contributes no live-service rows here.
Results
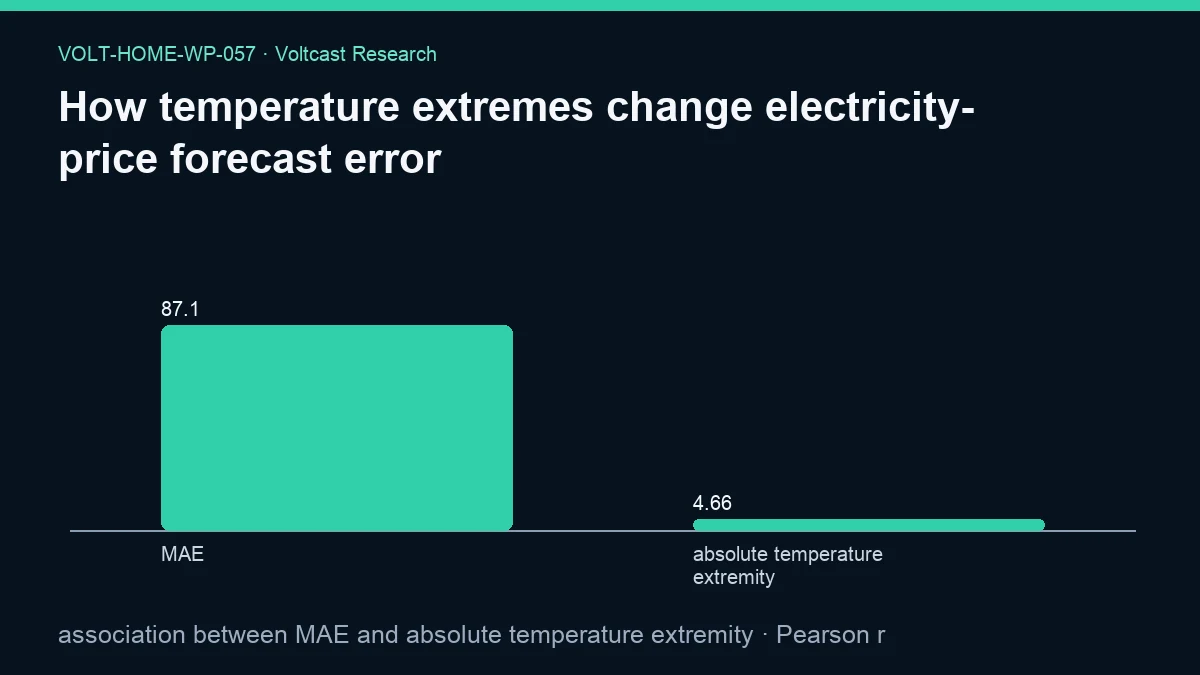
The primary result is a Pearson correlation of -0.0907959211562267 between lineage-matched MAE and absolute temperature extremity. The paired sample contains 17750 observations. The figure records a mean MAE of 87.14137855774648 EUR/MWh and a mean absolute temperature extremity of 4.660153971830987°C for scale; those marginal means are not the correlation. The negative sign means MAE tends to be lower as the measured distance from the pooled median temperature rises, but the relationship is weak.
The regenerated evidence records bootstrap_95_interval as null and the interval method as “not reported for this estimand.” No uncertainty interval accompanies -0.0907959211562267, and no significance claim is made from it.
The JSON reports no separate hot, cold, seasonal, zone, or horizon coefficients. It also does not report a nonlinear threshold effect. The evidence therefore does not support claims about heatwaves, cold snaps, or household heating demand individually.
Robustness and placebo checks
Serving-lineage matching is the principal anti-survivorship control. A forecast row enters only if the exact model version was recorded as served for the corresponding zone, date, and horizon bucket. That prevents a researcher from selecting a weather-specialist model retrospectively on extreme days.
The transformation to absolute distance avoids choosing a favorable hot-versus-cold sign after seeing the data, but it also combines regimes that may differ. No zone-specific climatology, calendar fixed effect, demand control, lead-lag placebo, forecast-temperature error, or shuffled-date test is included. UTC-date pairing can differ from a local market-day definition near date boundaries.
The family protocol names blocked uncertainty intervals for inferential claims, but this descriptive estimand reports none. Temporal dependence is therefore not quantified. There is no unadjusted inferential claim and thus no claimed Holm-adjusted discovery.
A same-date temperature permutation within zone and season would be an informative placebo because it would preserve local error scale while breaking the proposed weather alignment. A fixed-horizon panel would also reveal whether repeated horizons on one date drive the pooled coefficient. Neither result exists in the evidence. Likewise, there is no comparison between the recorded temperature and an issue-time forecast temperature, so the design cannot separate predictable extremity from unexpected weather error.
Limitations
A pooled median is not a meteorological normal. The same absolute temperature can be routine in one zone and exceptional in another. Pooling seasons also makes distance from the overall median partly a season indicator. A zone-specific day-of-year climatological anomaly would be more interpretable.
temp_best_c is an observed daily aggregate, not necessarily the issue-time temperature forecast available to the price model. The analysis therefore cannot tell whether price error comes from weather forecast error, price-model response, or unrelated market shocks. Daily averaging also removes hourly temperature-load shape that may matter for the price curve.
Repeated forecast rows can map to one zone-date temperature across horizons, creating dependence. Price MAE is scale-dependent across zones. Model versions change under serving governance. These factors make a pooled Pearson correlation an exploratory regime summary, not a stable causal parameter.
The extremity transformation is symmetric. Equal absolute departures on the warm and cold sides receive the same driver value even though electricity demand, renewable output, and network conditions can respond differently. It also assumes a linear monotonic relationship between distance and MAE. Thresholds, saturation, or opposite hot and cold effects could cancel in a single correlation. The public aggregate has no spline, bin, or tail-specific output from which to diagnose those possibilities.
Temperature coverage itself may differ by zone-date. The evidence retains finite pairs but does not publish missing-pair counts or source freshness for the temperature field. If availability is correlated with geography or season, the observed sample need not represent the complete serving fleet.
Practical implication
Temperature extremity alone should not be used as a rule for widening price uncertainty bands. The weak negative association shows that simple intuition can fail in pooled production evidence. A more useful monitoring system would stratify hot and cold anomalies within zone and season, then inspect price MAE, probabilistic coverage, and demand forecast error under the exact serving model.
For households, extreme outdoor temperature still matters for comfort, heat demand, and device constraints, regardless of whether the wholesale price forecast is easier or harder. Automation should preserve comfort and equipment limits rather than infer confidence from this correlation. The Voltcast Research Content Plan requires this counterintuitive result and its limitations to be published honestly.
Reproducibility
Verify the evidence file and manifest hash, then verify the snapshot, analysis-code, protocol, and registry hashes. Join accuracy to serving lineage on zone, delivery date, horizon bucket, and exact model version. Aggregate zone_temp_weighted to daily zone temperature, pair on zone and date, calculate the median paired temperature, transform values to absolute distance from that median, and calculate Pearson correlation with MAE.
A stronger follow-up should preregister zone-specific climatological anomalies, separate hot and cold tails, use local delivery dates, balance horizons and model versions, control season and demand, and block-resample dates while recomputing the full correlation or regression. It must remain a new result. Google Search Central's assigned Article structured data guidance supports visible and machine-readable provenance, not the empirical weather claim.
Disclosure
Analysis and drafting were model-assisted. The language model explained the frozen association and did not manufacture a mechanism or empirical value. Sources, methods, assumptions, limitations, and hashes are disclosed. This working paper is not peer reviewed.
Volt has zero live traders and zero live capital. C0R is the only paper strategy. Production forecasting is non-trading. This observational weather-error analysis is not trading advice, financial advice, a retail-bill forecast, or authorization for a model change.
References
- Voltcast. “Objective-specific seven-day forecast promotion.” https://github.com/ossedk/voltcast/blob/main/docs/voltcast/OBJECTIVE-PROMOTION-POLICY.md
- Voltcast. “Volt 6.1 cross-zone price model card.” https://github.com/ossedk/voltcast/blob/main/docs/voltcast/V6.1-MODEL-CARD.md
- Voltcast. “Voltcast Research Content Plan.” https://github.com/ossedk/voltcast/blob/main/docs/voltcast/RESEARCH-CONTENT-PLAN.md
- Google Search Central. “Article structured data.” https://developers.google.com/search/docs/appearance/structured-data/article
- ENTSO-E. “Single Day-ahead Coupling (SDAC).” https://www.entsoe.eu/network_codes/cacm/implementation/sdac/