How well calibrated are 14-day negative-price probabilities?
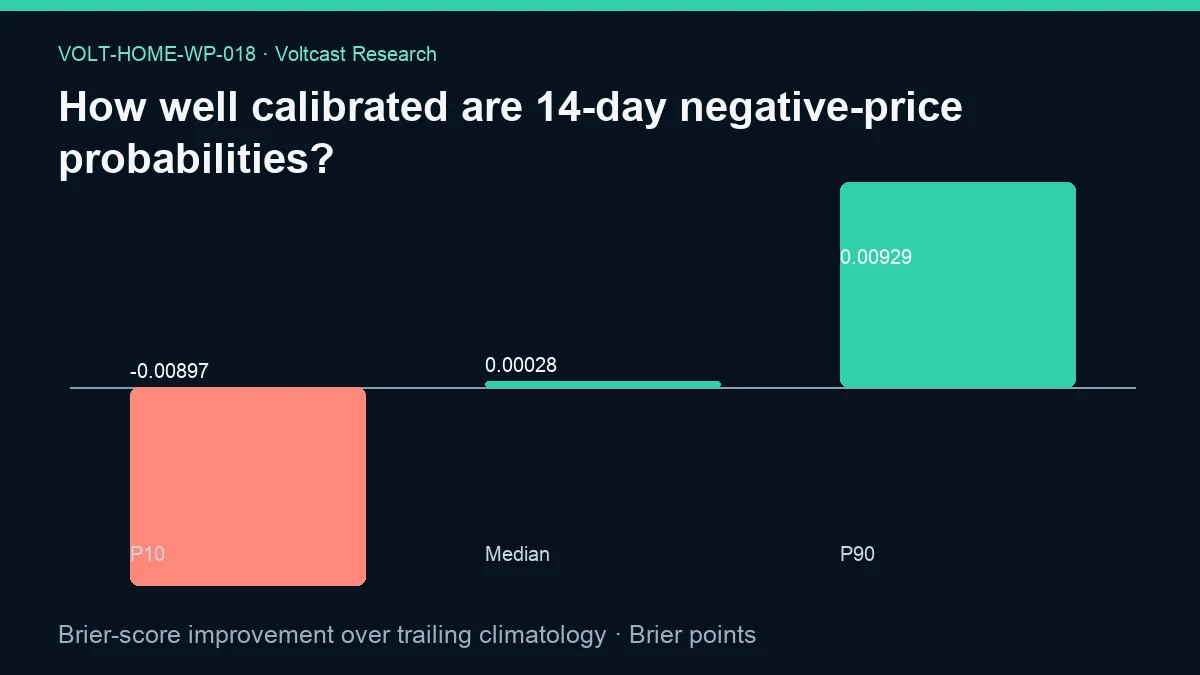
How well calibrated are 14-day negative-price probabilities. Positive values mean lower proper-scoring loss than the recorded baseline.
How well calibrated are 14-day negative-price probabilities?
Abstract
Probabilistic alerts should be judged with a proper score rather than by selecting a few striking events. This working paper compares registered 14-day wholesale negative-price probability forecasts with their recorded trailing-climatology baseline. Across 8,656 scored zone-days, the evidence reports a Brier-score improvement of 0.0013311518022181145 points. Positive improvement means the forecast had lower proper-scoring loss than the baseline under the evidence convention. The corrected evidence intentionally reports no bootstrap interval for this estimand.
The result is positive but narrowly defined. Brier score evaluates probabilistic accuracy as a whole; it is influenced by calibration and resolution and does not, by itself, prove perfect calibration at every probability or forecast horizon. The evidence includes all registered model versions and explicitly says serving status cannot be inferred. Consequently, this paper does not claim that the currently served model alone produced the aggregate result. It reports a frozen historical score comparison, not a household bill study, event guarantee, or trading recommendation.
Plain-language answer
The recorded probability forecasts performed slightly better than trailing climatology on the supplied Brier comparison. The improvement was 0.0013311518022181145 Brier points across 8,656 zone-days. Under the registered sign convention, positive is better because it means lower loss than the baseline. The figure’s machine-readable P10, Median, and P90 values are -0.008970000000000002, 0.00028, and 0.00929 Brier points.
That does not mean every alert was right or that a stated probability occurred at exactly that frequency in every subgroup. Brier score rewards probabilities that are close to outcomes and penalizes overconfident mistakes, but a single aggregate difference can hide performance by zone, horizon, season, probability bin, and model version. The answer is therefore “better than the recorded baseline in aggregate,” not “fully calibrated everywhere.”
Research question
The primary question is: how much does the Brier score of the registered 14-day negative-price probability forecasts improve over trailing climatology on the recorded scored rows? The estimand is baseline Brier loss minus forecast Brier loss, measured in Brier points. A positive value favors the forecast.
The title asks about calibration because reliability is central to probability use, but the primary evidence is a proper-score improvement rather than a reliability slope, intercept, or bin table. A Brier score combines aspects of calibration with the forecast’s ability to separate events from non-events. This paper does not claim those components have been decomposed when the JSON supplies only their aggregate score difference.
Data and provenance
The evidence declares daily prices from 2021-01-01 through 2026-08-29, detailed intervals from 2025-10-01 through 2026-08-29, and long-history coverage from 2015-01-01 through 2026-08-29. The scoring result contains 8,656 zone-days. The public evidence does not break that total down by forecast lead, zone, model version, or outcome class.
The source-table contract lists day_ahead_prices, generation_mix, border_flows, risk_accuracy, and zone_holidays. risk_accuracy is the direct scoring source, while realized day-ahead prices determine whether the target event occurred. The other tables belong to the registered family but are not evidence that generation, borders, or holidays were covariates in each scored model.
The current public-evidence JSON SHA-256 is f49675b7bc620c5c40f96c3d2c2a0b7a163525a600f4e7cbed560043e0c3ab55. The publication cutoff is 2026-08-30T00:00:00Z. The evidence records a read-only transaction and 180-second statement timeout. Analysis-code SHA-256 is 57c57de79cdab2b5b6d6c54c485cb5162598c5ba0b0bfe995da40d75e6c52ba9; protocol SHA-256 is adb36bf6b447af9f96339249b8becaefc20422499cca1977242866347a97bd4b; registry SHA-256 is 7bcb91d7476d0a69fe9fa75a5c7782f8117e0153f82f9112b7e1d307d3943717; snapshot SHA-256 is 7e97489fc8528c8cc8c38830e05b48d949ce1f67b98575dff26f5d7c321e4c67; and source-registry SHA-256 is 07949550ac443ff673fda5c0209b99f137544f3ffecf6775f109bb9d09663bd6. No assumptions are registered.
Method
For each scored zone-day, a forecast probability for the defined negative-price event is compared with the observed binary outcome using Brier loss. The same eligible rows receive a trailing-climatology baseline probability. The registered improvement subtracts forecast loss from baseline loss, so a positive result means the forecast’s loss is lower.
Proper scoring discourages a forecaster from gaining credit through unjustified certainty. A probability close to the eventual outcome receives less loss than one far from it. However, aggregating losses answers overall probabilistic accuracy, not every calibration question. Reliability assessment would additionally group comparable probabilities and compare predicted with observed frequency, while preserving enough data in each group.
The evidence says within-family Holm control applies to inferential claims and that the result makes no unadjusted significance claim. It intentionally provides no bootstrap interval for the aggregate improvement. A future supported interval should preserve dependence among horizons, zones, issue dates, and model versions rather than assume every scored row is independent.
Results
The primary result is a Brier-score improvement of 0.0013311518022181145 points over trailing climatology. The sample includes 8,656 scored zone-days, repeated as a secondary result. The evidence records bootstrap_95_interval as null and the interval method as “not reported for this estimand.” The figure distribution crosses zero, from P10 -0.008970000000000002 through Median 0.00028 to P90 0.00929 Brier points.
The result establishes lower aggregate Brier loss than the recorded baseline for the pooled registered score rows. It does not publish the forecast and baseline Brier scores separately, so their absolute quality cannot be reconstructed from the improvement alone. It also does not show calibration by probability bin, lead day, or zone.
All registered model versions are included. That prevents silent selection of only a favored version, but it also means the aggregate is not a serving-lineage verdict. A historical version may contribute rows even if it is no longer served, and a current version cannot inherit the pooled score without a lineage-specific calculation. The evidence explicitly warns that serving status is not inferred.
Robustness and placebo checks
Using a proper score and a trailing-climatology comparator is the central robustness design. A raw accuracy count can reward trivial predictions when events are rare; Brier loss retains probability quality. The baseline asks whether the forecast adds value beyond recent event frequency under the recorded climatology method.
The result would be more diagnostic with reliability diagrams, calibration intercept and slope, lead-specific score differences, and zone-level estimates. Alternative baselines could include seasonal or calendar-matched climatology if preregistered. The JSON does not publish those numerical checks, so this paper does not claim they passed.
Including every registered model version guards against survivorship bias from displaying only a winner. Robustness still requires lineage labels so readers can see whether poor and strong versions offset each other. Any future interval should also block repeated rows appropriately. The family Holm rule applies to inferential claims; this descriptive paper preserves the intentional absence of an interval and does not convert figure percentiles into uncertainty bounds.
Limitations
The evidence’s explicit limitation is that scores include all registered model versions and serving status is not inferred. The aggregate therefore cannot answer which version a user receives today or whether a specific version passes a promotion gate. It also does not separate forecast horizons within the 14-day product.
Brier improvement alone is not a full calibration audit. It can improve because of resolution even when some probability bins are miscalibrated, and it can hide rare but severe overconfidence. The public result lacks event prevalence, absolute scores, bin counts, model-version splits, and zone-level distributions. The sample’s dependence structure is not exposed in the JSON.
The analysis does not estimate household bills or device performance. A better event probability can support planning, but realized value depends on the retail tariff, decision rule, false-alert cost, device availability, and safe fallback. The paper is model-assisted, not peer reviewed, and not trading advice. It does not guarantee an event or recommend a market position.
Practical implication
A home-energy application can use probabilities more responsibly than binary certainty. The positive aggregate improvement supports showing the registered probability alongside its horizon and baseline context. It does not support hiding uncertainty behind a categorical “negative prices coming” message.
Operationally, an application should identify the model version, issue time, target day, and freshness; reject stale forecasts; and display reliability evidence for the same lineage when available. Household automation should combine the probability with consequences. A low-cost reversible action may tolerate a different threshold from an action affecting comfort or battery degradation. The evidence does not prescribe those thresholds or promise savings.
Reproducibility
A reproducer should verify the hashes and cutoff, enumerate the 8,656 scored zone-days, and retain every registered model version. For each eligible row, it should reconstruct the binary outcome, forecast probability, and trailing-climatology probability under the exact issue and target clocks. It should calculate both Brier losses and reproduce an improvement of 0.0013311518022181145 points under the positive-is-better convention.
The reproduction should preserve the intentional null interval and reproduce figure values -0.008970000000000002, 0.00028, and 0.00929 for P10, Median, and P90. Results should be split by model version, zone, and lead as diagnostics without replacing the preregistered pooled output. A serving claim requires explicit lineage evidence rather than inference from the aggregate.
The governance source is Voltcast’s Voltcast Research Content Plan. Assigned context is Electricity 2026 from the International Energy Agency, Rewarding flexibility: How retail contract choice can help unlock consumer flexibility from ACER and CEER, EU electricity trading in the day-ahead markets becomes more dynamic from the European Commission, and Single Day-ahead Coupling (SDAC) from ENTSO-E. No unreported forecast result is attributed to these references.
Disclosure
Analysis and drafting were model-assisted; sources, code, assumptions, and evidence hashes are disclosed. This public working paper has not been peer reviewed. It reports a pooled proper-score comparison across registered model versions, not a guarantee of current serving quality. It is not a household bill study, savings estimate, or trading advice. No authors, credentials, source dates, digital object identifiers, or external findings were invented.
References
- International Energy Agency — Electricity 2026
- ACER and CEER — Rewarding flexibility: How retail contract choice can help unlock consumer flexibility
- European Commission — EU electricity trading in the day-ahead markets becomes more dynamic
- ENTSO-E — Single Day-ahead Coupling (SDAC)
- Voltcast — Voltcast Research Content Plan