What happens immediately after a negative-price episode?
What happens immediately after a negative-price episode. The transition statistic measures immediate curve shape, not a tradable return.
What happens immediately after a negative-price episode?
Abstract
This working paper describes the first native delivery interval immediately following a contiguous negative day-ahead price episode. The evidence reports a mean first-interval price rebound of 1.8301443123938879 EUR/MWh across 1,178 eligible transitions. Its recorded bootstrap endpoints are 1.5503251273344654 and 2.1643941001697793 EUR/MWh. The positive mean indicates that the first post-episode interval moved upward under the registered transition statistic.
The statistic measures curve shape, not a tradable return. Day-ahead intervals are auction outcomes for physical delivery periods; moving from one interval to the next is not the same as buying at one price and selling at another with executable orders, storage, efficiency, fees, or a household retail contract. Detailed episode metrics use ten representative zones after 2025-10-01. The result is descriptive, carries no unadjusted significance claim, and does not establish why prices changed. It should be read as an observed local transition in a frozen market curve, not as evidence of household savings or trading profitability.
Plain-language answer
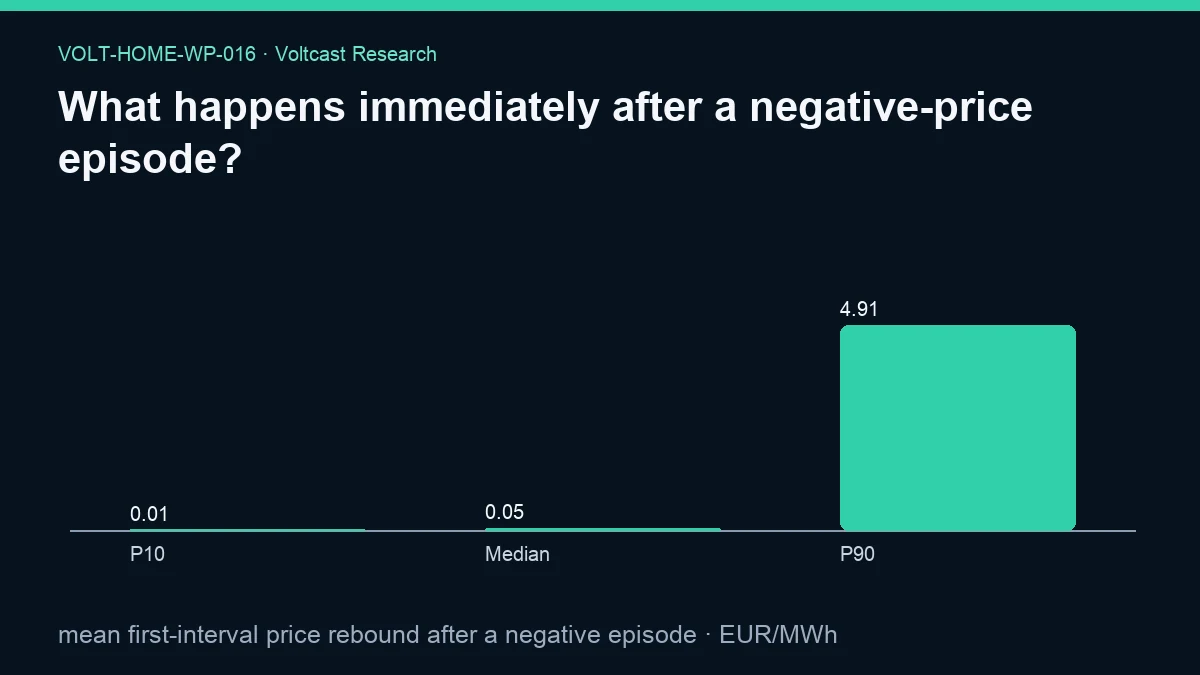
On average, the first interval after a negative-price episode was 1.8301443123938879 EUR/MWh higher under the study’s registered rebound measure. The evidence’s bootstrap endpoints run from 1.5503251273344654 to 2.1643941001697793 EUR/MWh. There were 1,178 eligible episode transitions in the calculation. The figure separately reports P10, Median, and P90 rebound values of 0.01, 0.05, and 4.912999999999999 EUR/MWh.
That does not mean the next price became positive in every case, nor does it say every event rebounded by the mean. A price can rise while remaining below zero, and individual transitions can differ. The public evidence does not provide the share of positive moves or the full distribution. It also does not turn the observed interval difference into a household action: a device uses electricity during delivery intervals and faces a retail tariff, not an abstract return between two points.
Research question
The research question is: what is the mean registered price rebound in the first native delivery interval after a contiguous negative day-ahead price episode ends? The target is deliberately local in time. It does not estimate a multi-interval recovery path, a return to a normal regime, or a forecast of the next episode.
This question is distinct from episode duration and depth. It begins only once an episode has ended and requires an observable following interval. An episode at a data boundary or without a valid adjacent successor may not be eligible, which is one reason a transition sample need not equal the total episode count reported elsewhere in the research cluster. The current evidence supplies 1,178 transitions but no row-level exclusion breakdown, so the paper does not invent one.
Data and provenance
The evidence declares daily price coverage from 2021-01-01 to 2026-08-29, detailed interval coverage from 2025-10-01 to 2026-08-29, and long-history coverage from 2015-01-01 to 2026-08-29. Its explicit limitation says detailed episode metrics use ten representative zones after 2025-10-01. The rebound result should therefore be tied to that detailed window rather than presented as a balanced estimate over the full long-history field.
The family source tables are day_ahead_prices, generation_mix, border_flows, risk_accuracy, and zone_holidays. This transition statistic comes from the ordered day-ahead price curve. The other tables identify the broader research contract; the evidence does not report that generation, borders, forecast risk, or holidays explain the rebound. There are no registered assumptions or synthetic scenarios in this paper.
The current public-evidence JSON SHA-256 is 3757b2746c8e605c97af7223e26cd6045941e3b42123051e1d86be2d41b217d3. The publication cutoff is 2026-08-30T00:00:00Z. The analysis used a read-only transaction and a 180-second statement timeout. Analysis-code SHA-256 is 57c57de79cdab2b5b6d6c54c485cb5162598c5ba0b0bfe995da40d75e6c52ba9; protocol SHA-256 is adb36bf6b447af9f96339249b8becaefc20422499cca1977242866347a97bd4b; registry SHA-256 is 7bcb91d7476d0a69fe9fa75a5c7782f8117e0153f82f9112b7e1d307d3943717; snapshot SHA-256 is 7e97489fc8528c8cc8c38830e05b48d949ce1f67b98575dff26f5d7c321e4c67; and source-registry SHA-256 is 07949550ac443ff673fda5c0209b99f137544f3ffecf6775f109bb9d09663bd6.
Method
The analysis identifies contiguous sequences of native day-ahead intervals priced below zero. For every episode with a valid first interval after the sequence, it calculates the registered rebound quantity and then averages those transition values across the eligible sample. Native chronological ordering is essential: the successor must be the actual next delivery interval, not merely the next stored row after filtering.
The evidence names the metric “mean first-interval price rebound after a negative episode.” The public JSON does not provide a more detailed formula, so reproduction must obtain the exact subtraction convention from the hashed code or protocol. This paper does not silently choose whether the comparator is the last negative interval, an episode average, or another defined reference. It retains the registered name and interpretation.
The method family includes episode survival, matched calendar controls, reliability scoring, and network lead-lag analysis. The evidence says within-family Holm control applies to inferential claims, while this result makes no unadjusted significance claim. The bootstrap field brackets the point estimate and uses the stated “day/row-block mean bootstrap” method, but no causal or family-wise significance conclusion is added.
Results
The primary result is a mean first-interval rebound of 1.8301443123938879 EUR/MWh over 1,178 eligible transitions. The evidence records bootstrap endpoints of 1.5503251273344654 and 2.1643941001697793 EUR/MWh. The point estimate and both endpoints are positive under the registered rebound convention.
The result indicates an average upward local transition. It does not state the first following price level, the proportion of transitions that rose, or whether the successor interval was above zero. A mean can be influenced by larger changes. The corrected evidence now publishes machine-readable P10, Median, and P90 figure values of 0.01, 0.05, and 4.912999999999999 EUR/MWh; these are distribution summaries rather than the bootstrap interval for the mean.
Most importantly, 1.8301443123938879 EUR/MWh is not a realizable return. No trade entry, exit, spread, fee, latency, capacity, storage constraint, round-trip efficiency, or retail pass-through is included. The evidence itself says the transition statistic measures immediate curve shape, not a tradable return.
Robustness and placebo checks
Chronological adjacency is the principal construction check. A reproduction should ensure intervals are contiguous in delivery time, honor native market time units, and do not cross missing-data gaps or zone boundaries. Daylight-saving transitions must be represented by actual timestamps rather than assumed fixed local-clock steps.
The recorded bootstrap range provides a sensitivity summary around the mean using the stated day/row-block mean bootstrap. Episode transitions from the same zone or day may be dependent, so the block structure is material. A robust implementation should confirm the precise day/row resampling construction and compare mean and median transitions. No numerical outputs for such alternatives appear in the evidence, so no pass is claimed.
Useful placebos could examine non-event boundaries, calendar-matched ordinary transitions, or time-shifted episode endpoints. They would test whether an upward move is special to the end of a negative episode or simply reflects common intraday curve shape. The method family mentions matched calendar controls, but this JSON supplies no placebo estimate. Holm control governs inferential claims across the family; the current result remains descriptive.
Limitations
Detailed episode metrics cover ten representative zones only after 2025-10-01. The evidence does not publish zone weights or transition-level records, so pooled results may hide geographic and seasonal variation. The sample contains 1,178 eligible transitions, but the public JSON does not enumerate exclusions or explain why other episodes lack a successor.
The metric formula is not fully expanded in the JSON. Although “rebound” and the interpretation indicate an immediate upward transition measure, a rigorous replication must verify the reference price in the code. The evidence now identifies the interval method as a day/row-block mean bootstrap, while implementation details still require the code. These are documentation limits, not invitations to guess.
The statistic cannot separate market mechanisms. An episode may end as demand rises, variable generation falls, constraints change, or coupled prices shift, but none is causally tested here. No household tariff, bill, device, capacity, efficiency, comfort constraint, or counterfactual schedule is included. The paper is not peer reviewed, and its observed curve transition is not trading advice.
Practical implication
For household scheduling, the result is a reminder that a negative window can close quickly and that the price immediately after it may be higher on average. A controller should therefore optimize over explicit intervals rather than assume nearby hours share the same price sign. It should also preserve the user’s constraints and actual retail tariff.
This does not mean a device should always stop at the episode boundary. Minimum run times, thermal dynamics, charging targets, network charges, and comfort may make continued operation sensible. The evidence supplies no optimization model. A safe implementation should refresh the curve, verify timezone and interval semantics, and explain that the wholesale transition statistic is context rather than a guaranteed saving.
Reproducibility
A reproduction should verify the six hashes, enforce the 2026-08-30T00:00:00Z cutoff, and use the detailed interval window and eligible zones defined by the protocol. It should sort each zone’s native day-ahead intervals by delivery timestamp, identify contiguous below-zero episodes, require a valid immediate successor, compute the protocol’s exact rebound, and reproduce 1,178 transitions.
The aggregate target is 1.8301443123938879 EUR/MWh, with recorded bootstrap endpoints 1.5503251273344654 and 2.1643941001697793 EUR/MWh under the day/row-block mean bootstrap. The rerun should also reproduce figure values 0.01, 0.05, and 4.912999999999999 for P10, Median, and P90, and state the comparator used in the subtraction, treatment of gaps and revisions, and timezone normalization.
The governing content source is Voltcast’s Voltcast Research Content Plan. Exact assigned context is linked through Electricity 2026 from the International Energy Agency, Rewarding flexibility: How retail contract choice can help unlock consumer flexibility from ACER and CEER, EU electricity trading in the day-ahead markets becomes more dynamic from the European Commission, and Single Day-ahead Coupling (SDAC) from ENTSO-E. These links are context, not sources of unreported rebound estimates.
Disclosure
Analysis and drafting were model-assisted; sources, code, assumptions, and evidence hashes are disclosed. This working paper has not been peer reviewed. It reports an observed day-ahead curve transition, not an executable return, and it is not a household bill study, savings estimate, or forecast guarantee. It is not trading advice and recommends no transaction, tariff, investment, or appliance. No authors, credentials, source dates, digital object identifiers, or empirical findings were invented.
References
- International Energy Agency — Electricity 2026
- ACER and CEER — Rewarding flexibility: How retail contract choice can help unlock consumer flexibility
- European Commission — EU electricity trading in the day-ahead markets becomes more dynamic
- ENTSO-E — Single Day-ahead Coupling (SDAC)
- Voltcast — Voltcast Research Content Plan