Which European zones offer the strongest heat-pump flexibility signal?
Which European zones offer the strongest heat-pump flexibility signal. The ranking is a market flexibility signal, not a building-level savings forecast.
Which European zones offer the strongest heat-pump flexibility signal?
Abstract
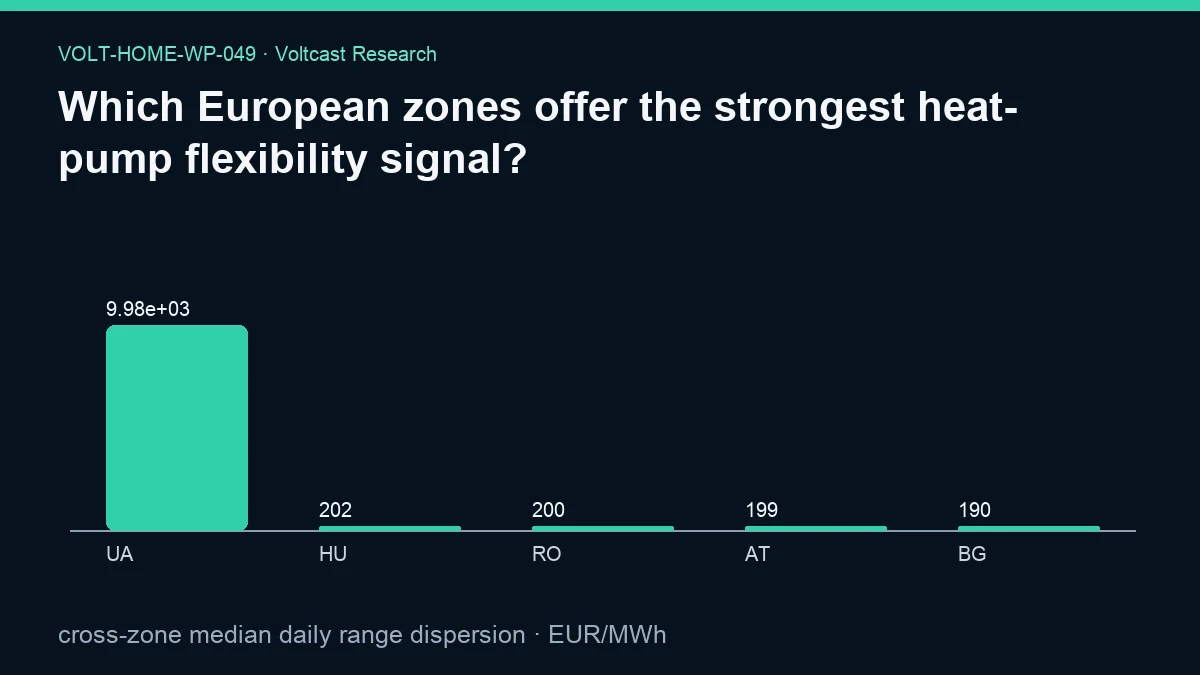
Wholesale price variation creates an opportunity for flexible heating only when a building can safely move electricity use between intervals. This working paper isolates the market side by calculating each zone’s mean daily maximum-to-minimum day-ahead price range and ranking 47 zones. The registered highest-signal zone is UA. The figure’s top five are UA, HU, RO, AT, and BG, with displayed mean-range values of approximately 9.98×10³, 202, 200, 199, and 190 EUR/MWh. Cross-zone population standard deviation of the 47 zone-level mean ranges is 1,423.8574145742482 EUR/MWh, the registered primary result. The large dispersion is visibly dominated by UA’s extreme scale, so a reader should not interpret 1,423.86 as a typical inter-zone difference. No uncertainty interval is reported for this estimand. The ranking is a market flexibility signal, not a building-level savings forecast. It does not include COP, comfort, heat demand, or complete retail tariffs. The reduced-order synthetic scenarios are not building simulations, customer telemetry, savings claims, or retail bills.
Plain-language answer
Under the frozen ranking, UA has the largest observed mean daily wholesale price range. HU, RO, AT, and BG follow in the displayed top five. But UA’s chart value is around 9,980 EUR/MWh, whereas the other four are around 190–202 EUR/MWh. That exceptional gap drives the cross-zone dispersion.
The ranking says where recorded wholesale prices varied most under this statistic. It does not say where a household heat pump saves most. A home also needs thermal inertia, a usable comfort band, a suitable COP, enough device power, and a tariff that passes through the relevant price variation. The Energy and Buildings study supplies assigned context for the dependence of thermal flexibility on buildings and tariffs. The Nordic cost–comfort study supplies assigned context for the fact that market opportunity cannot be separated from comfort objectives in an actual controller.
Research question
The registered question asks which European zones offer the strongest heat-pump flexibility signal. We define the signal as each zone’s arithmetic mean daily day-ahead price range, calculated as daily maximum minus daily minimum, over the frozen matched price-temperature observations.
That definition measures market variation only. It does not estimate heating load, COP, building stock, tariff adoption, or attainable household value. The primary metric is cross-zone dispersion in the 47 zone-level means, and the secondary result identifies the highest-ranked zone. This narrow definition keeps the analysis reproducible and prevents the word “flexibility” from being mistaken for observed customer response.
Data and provenance
The evidence has publication cutoff 2026-08-30T00:00:00Z. Its declared daily-price window is 2021-01-01 through 2026-08-29; detailed intervals span 2025-10-01 through 2026-08-29; and long-history coverage spans 2015-01-01 through 2026-08-29. The registered source-table contract includes day_ahead_prices, zone_temp_weighted, zone_load, generation_mix, and forecasts.
For this paper, daily price summaries are associated with available population-weighted zone temperature records, then grouped by zone. Forty-seven zones have values in the ranking. Within each zone, the analysis averages daily maximum-minus-minimum price ranges. Temperature provides the matched thermal-context panel but is not used to weight the range by heat demand.
The run used a read-only transaction and a 180-second statement timeout. The snapshot SHA-256 is 7e97489fc8528c8cc8c38830e05b48d949ce1f67b98575dff26f5d7c321e4c67; analysis-code SHA-256 is 57c57de79cdab2b5b6d6c54c485cb5162598c5ba0b0bfe995da40d75e6c52ba9; protocol SHA-256 is adb36bf6b447af9f96339249b8becaefc20422499cca1977242866347a97bd4b; registry SHA-256 is 7bcb91d7476d0a69fe9fa75a5c7782f8117e0153f82f9112b7e1d307d3943717; and source-registry SHA-256 is 07949550ac443ff673fda5c0209b99f137544f3ffecf6775f109bb9d09663bd6. The evidence and figure hashes are 1d399016f828fcad89a807e7b9aee2ebea27aeb1316c91edc597fd7a3f99a00b and 933e68f174cbfefeae5da1832fca3eb8d5049a55322888f8ff95f4c628f30e77.
ACER and CEER provide assigned context on regional differences and contract choice. The registered European Commission communication concerns retail prices and flexibility. The dynamic-tariff viability study provides assigned context for why price spreads alone do not settle household economics. No external ranking or numerical value is imported.
Method
For each zone-day with the required matched records, the analysis computes max_price - min_price. It groups those daily ranges by zone and takes the arithmetic mean for each group. It sorts zone codes in descending order of their mean range.
The secondary result is the first code in that sorted list, UA. The figure displays the first five codes and values. The primary metric is the population standard deviation across all 47 zone-level mean ranges, calculated with a population rather than sample denominator. Although the evidence names the metric “cross-zone median daily range dispersion,” the frozen implementation ranks zone means and computes their population standard deviation. This paper states that implementation directly to avoid implying a median calculation that was not performed.
The assumptions are synthetic heat demand, no customer telemetry, COP sensitivity declared per paper, and wholesale energy only. There is no COP adjustment, demand weighting, currency conversion beyond the stored EUR/MWh values, retail markup, tax, network charge, or household energy quantity.
The regenerated evidence reports no uncertainty interval and names the interval method as “not reported for this estimand.” Within-family Holm control applies to inferential claims; the ranking and dispersion are descriptive and carry no unadjusted significance claim.
Results
The highest-signal zone is UA. The top-five chart order is UA, HU, RO, AT, and BG. The figure values are 9980.77596153846 EUR/MWh for UA, 202.40541666666667 for HU, 199.89735745614036 for RO, 199.18404605263157 for AT, and 189.82963815789475 for BG. The sample size for the cross-zone distribution is 47.
The registered cross-zone population standard deviation is 1,423.8574145742482 EUR/MWh. The evidence reports no uncertainty interval for that dispersion or for the zone-level mean-range input. Because UA is orders of magnitude above the other displayed leaders, both the standard deviation and any aggregate mean are highly sensitive to that observation.
The result establishes heterogeneity, not typicality. It identifies where the frozen recorded range statistic is highest, but does not explain whether UA’s value reflects persistent market structure, isolated extremes, data coverage, or another factor. It would be improper to promote UA as the best household market without separate data-quality, tariff, thermal, and risk analysis.
Robustness and placebo checks
The complete 47-zone calculation avoids selecting only familiar western European markets. Sorting is deterministic, and the top-five display follows the same zone-level statistic used for all zones. The population-standard-deviation formula is also explicit.
The most important robustness warning is the visible outlier. The evidence does not report an outlier-trimmed dispersion, median absolute deviation, winsorized ranking, common-date panel, or minimum-coverage filter in the paper artifact. It would be incorrect to claim that UA remains first under those alternatives. No leave-one-zone-out placebo is reported.
No bootstrap interval is reported, and an interval would not substitute for coverage and data-quality checks. There is no heat-demand placebo, no COP-adjusted ranking, and no comparison against realized customer value. Within-family Holm control applies to inferential claims; this descriptive cross-section uses no p-value. A stronger follow-up would freeze common dates and report robust dispersion with and without the largest observation, but that would be new work.
Limitations
Daily maximum-to-minimum price range is an upper opportunity envelope. A heat pump may be unable to consume in the cheapest interval or avoid the most expensive interval. The range also gives extreme observations substantial influence and does not report how often large spreads occur.
Coverage can differ by zone. The evidence does not expose per-zone observation counts in this paper’s public primary result, so the ranking cannot be assumed to compare identical dates. Differences may reflect sample composition as well as market structure. The extreme UA value requires particular caution and should be investigated before any operational use.
No thermal model is present. Daily temperature and price summaries cannot reproduce a building-specific thermal state. The ranking ignores COP, outdoor-temperature sensitivity, comfort, equipment capacity, heat demand, building envelope, and rebound.
Wholesale prices are not household tariffs. Network charges, taxes, supplier margin, fixed fees, consumer protection, and price caps can change or dilute the signal. The reduced-order synthetic scenarios are not building simulations, customer telemetry, savings claims, or retail bills. The ranking is not a savings league table, installation recommendation, or market-entry recommendation.
Practical implication
Use zone price-range rankings to prioritize careful local analysis, not to choose a heat pump or tariff. For a given household, first validate data completeness, then combine interval prices with the actual tariff, expected COP, heat demand, comfort limits, and safe power constraints.
For public comparisons, report robust statistics and coverage beside the ranking. An extreme zone should trigger a provenance and sensitivity review rather than a marketing claim. The assigned policy and economic sources reinforce that contract availability, enabling technology, and household circumstances determine whether wholesale variation becomes usable flexibility.
Reproducibility
The canonical public evidence is /research-data/home-papers/which-european-zones-offer-the-strongest-heat-pump-flexibility-signal.json; the figure is /research-media/home-papers/which-european-zones-offer-the-strongest-heat-pump-flexibility-signal.webp. The JSON freezes the paper identity, status, source tables, windows, assumptions, primary dispersion, secondary highest-zone result, explicit null interval, interpretation, and provenance hashes.
To reproduce, calculate daily maximum-minus-minimum prices for every matched zone-day. Group by zone, compute each group’s arithmetic mean, sort descending, and calculate population standard deviation across the resulting 47 means. Preserve the frozen cutoff and data snapshot. Do not substitute a median, trimmed mean, or common-date filter and still call it the same result; those are valuable but distinct analyses.
Licensing and attribution conditions are documented at /legal/data-licensing and Voltcast data licensing and redistribution. Reuse must preserve the warning that this is a market signal rather than a building-level savings forecast.
Disclosure
Analysis and drafting were model-assisted; sources, code, assumptions, and evidence hashes are disclosed. This working paper is not peer reviewed. It is not trading advice, contains no trading claim, and does not authorize capital or live control. Volt has no live traders or live capital. The ranking should not be treated as investment, tariff, or equipment advice.
References
- Energy and Buildings. “Assessment of the thermal energy flexibility of residential buildings with heat pumps under various electric tariff designs.” https://doi.org/10.1016/j.enbuild.2023.113257
- Energies. “Exploring Cost–Comfort Trade-Off in Implicit Demand Response for Fully Electric Solar-Powered Nordic Households.” https://doi.org/10.3390/en18215568
- ACER and CEER. “Rewarding flexibility: How retail contract choice can help unlock consumer flexibility.” https://www.ceer.eu/wp-content/uploads/2025/11/ACER-CEER-2025-Retail-monitoring.pdf
- European Commission. “Communication from the Commission on the Citizens Energy Package.” https://eur-lex.europa.eu/legal-content/EN/TXT/?uri=CELEX%3A52026DC0115
- Advances in Applied Energy. “Assessing the conditions for economic viability of dynamic electricity retail tariffs for households.” https://doi.org/10.1016/j.adapen.2024.100174