Which market properties predict smart-charging value across Europe?
Which market properties predict smart-charging value across Europe. The range is a simple cross-market predictor; the result is descriptive and evaluated on observed days.
Abstract
Smart-charging value requires price dispersion: if every feasible interval has the same price, moving energy cannot lower wholesale scenario cost. This paper tests daily day-ahead price range as a simple cross-market predictor of an 18 kWh charging scenario’s value. The frozen assumptions are wholesale energy only, perfect charger efficiency, and local availability from 17:00 to 07:00. Across 3,330 paired observations, the Pearson correlation between daily maximum-minus-minimum price range and wholesale smart-charging scenario value is 0.7394366549836897. The association is positive and substantial, but descriptive. It does not prove that greater range causes realizable charging value or that full-day extremes fall inside the charging window. The regenerated evidence reports no interval for this estimand. Daily price range is therefore a useful screening feature in this corpus, not a complete valuation model.
Plain-language answer
Among the market properties measured for this paper, daily price range is the reported predictor. Days with a wider gap between maximum and minimum day-ahead prices tend to show more wholesale scenario value from price-aware EV scheduling. The measured association is Pearson r = 0.7394366549836897.
That relationship makes intuitive sense but is not automatic. The daily minimum might occur before the vehicle arrives, and the daily maximum might occur after it departs. A wide full-day range can therefore overstate the dispersion available inside 17:00–07:00. Charger power and energy need also determine whether the cheapest intervals can be used.
The answer is consequently “daily range is informative, but incomplete.” It can help screen markets and days for potential scheduling value. It cannot replace a constraint-aware interval calculation.
Research question
The question is: across observed European zone-days, how strongly does daily day-ahead price range predict wholesale smart-charging scenario value?
Daily range is maximum recorded price minus minimum recorded price for the zone-day. Charging value compares an 18 kWh habitual evening reference with the cheapest feasible allocation in the declared overnight window at 7.4 kW. Pearson correlation summarizes their linear association.
The study does not compare range with a full set of competing predictors. “Which market properties” is answered only to the extent of the evidence’s single reported property. Volatility, negative-price frequency, season, renewable share, and congestion may be relevant, but no result for them is invented here.
Data and provenance
The registered contract includes day_ahead_prices, forecasts, forecast_accuracy, generation_mix, and zones. The direct inputs are detailed price intervals, daily minimum and maximum prices, and zone timezones.
The evidence declares daily prices from 2021-01-01 through 2026-08-29, detailed intervals from 2025-10-01 through 2026-08-29, and long history from 2015-01-01 through 2026-08-29. Publication cutoff is 2026-08-30T00:00:00Z. Extraction used a read-only transaction and 180-second statement timeout.
Snapshot SHA-256 is 7e97489fc8528c8cc8c38830e05b48d949ce1f67b98575dff26f5d7c321e4c67. Protocol, registry, source-registry, and analysis-code hashes are adb36bf6b447af9f96339249b8becaefc20422499cca1977242866347a97bd4b, 7bcb91d7476d0a69fe9fa75a5c7782f8117e0153f82f9112b7e1d307d3943717, 07949550ac443ff673fda5c0209b99f137544f3ffecf6775f109bb9d09663bd6, and 57c57de79cdab2b5b6d6c54c485cb5162598c5ba0b0bfe995da40d75e6c52ba9.
Method
For each eligible zone-day, the analysis converts interval timestamps to local time. The smart schedule considers intervals at or after 17:00 or before 07:00, ranks them by price, and fills an 18 kWh event at no more than 7.4 kW while respecting recorded duration.
The reference uses the mean price of intervals from 18:00 to 24:00 local time multiplied by 18 kWh. The optimized wholesale scenario cost is subtracted from that reference, producing the day’s smart-charging wholesale scenario value.
The predictor comes from the daily aggregate table: maximum price minus minimum price. Keys with both daily range and finite charging value are paired. Pearson r is calculated from centered values divided by their joint dispersion. The primary result is the correlation across 3,330 observations.
Because both variables use prices from the same day, the result is contemporaneous and descriptive. It is not an out-of-sample forecast. The method family is constraint-aware charging simulation with paired schedule regret and scenario sensitivity. Holm control applies to inferential family claims; no unadjusted significance claim is made.
Results
The measured association between daily price range and wholesale smart-charging scenario value is Pearson r = 0.7394366549836897 across 3,330 paired observations. The positive sign means wider-range days tend to have greater modeled scheduling value.
The magnitude indicates that range carries meaningful information in this sample, but correlation is not a share of value explained and should not be converted into a monetary amount. It also does not establish predictive performance on future days.
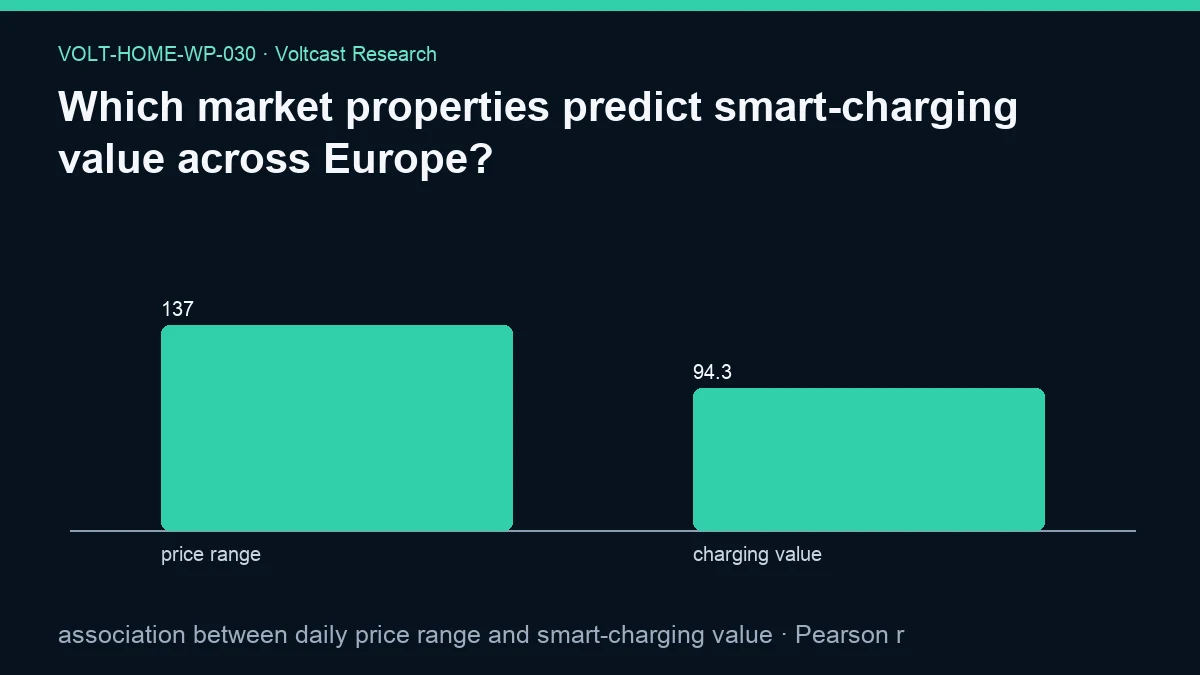
The JSON reports bootstrap_95_interval: null and no interval method for this estimand. No uncertainty range is therefore attached to r = 0.7394366549836897. The figure values are price range = 136.65184684684687 and charging value = 94.27168482982982; they are descriptive figure inputs, not the correlation coefficient.
Robustness and placebo checks
Pairing range and charging value by the same zone-day avoids comparing unrelated time periods. The predictor is simple, transparent, and independent of a fitted multivariable model. Pearson r can be reproduced without tuning or feature selection.
A flat price day is the conceptual placebo: when maximum and minimum coincide, range provides no price dispersion. Whether modeled value is exactly zero still depends on the reference construction and eligible-window completeness; the evidence does not publish that subgroup.
No out-of-sample split, rank correlation, zone fixed effects, seasonal control, alternative within-window range, or competing-feature model appears in the evidence. No correlation interval is reported. The result remains association-only under the registered multiplicity policy.
The simple predictor avoids overfitting through feature search, but it also leaves obvious benchmark questions unanswered. A within-window range, an interquantile spread, or a count of usable low-price intervals could be more closely aligned with the charger’s feasible set. None is scored in this evidence, so daily full range retains only the status of the registered descriptive predictor.
An out-of-sample placebo would freeze a relationship on an earlier window and evaluate predictions on later zone-days without refitting. The current calculation is contemporaneous across the observed panel. Its r of 0.7394366549836897 should therefore not be described as forecast skill.
Limitations
Daily full-range extremes may occur outside 17:00–07:00, so the predictor is not matched perfectly to the feasible charging window. A within-window range could be more decision-specific, but it is not the registered result.
Both predictor and outcome are functions of the same day’s prices. Mechanical shared variation can strengthen association. The habitual reference from 18:00 to 24:00 also influences the outcome and may differ from actual unscheduled charging.
Every monetary input is a wholesale scenario value. Synthetic charging scenarios are not customer bills and exclude taxes, network charges, supplier margin, and battery losses. Charger losses and behavioral response are also absent. Perfect efficiency and a fixed 18 kWh event at 7.4 kW do not describe every vehicle.
The aggregate can mix cross-zone and within-zone relationships. It does not publish zone-specific coefficients, demonstrate future predictive accuracy, or report a confidence interval for the correlation.
Daily maximum and minimum can be sensitive to isolated extreme intervals. Range ignores how long either condition persists and whether enough energy can be moved. An 18 kWh event at 7.4 kW needs a sequence of deliverable energy, not merely one low-priced point. The constraint-aware outcome partly captures that need, but the predictor does not.
The reference behavior is also modeled. Mean price from 18:00 to 24:00 is not a record of when unscheduled drivers charged. A different reference could change wholesale scenario value and its association with range. The result is valid for the frozen definition, not every interpretation of smart-charging value.
Practical implication
Daily price range can be used as an interpretable screening signal for where detailed smart-charging analysis may be worthwhile. It is easy to compute and, in this evidence, strongly associated with the modeled outcome.
It should not drive charging directly. A controller still needs native interval prices, local timestamps, availability, energy requirement, and power limits. Full-day range cannot tell the charger which intervals are feasible or cheapest.
For market comparisons, analysts should separate a screening statistic from a valuation. The r of 0.7394366549836897 supports range as a useful descriptor in the frozen panel, not as a universal or causal model.
Screening can still be operationally useful. A research pipeline could use daily range to prioritize days for a full interval-level calculation while always publishing the final constraint-aware result. That saves no evidence requirement: it merely orders analysis. A consumer-facing controller should never substitute the screening score for a schedule.
Cross-market comparisons should also distinguish dispersion from absolute price level. A high-price day can have a narrow range, and a lower-price day can have a wide range. This paper reports association with flexibility value, not whether electricity is cheap in absolute terms.
Reproducibility
Verify ID, title, slug, measured status, assumptions, windows, metric, value, sample size, figure metadata, and hashes against the public evidence JSON. Verify all five references against the source registry.
Using snapshot 7e97489fc8528c8cc8c38830e05b48d949ce1f67b98575dff26f5d7c321e4c67 and code 57c57de79cdab2b5b6d6c54c485cb5162598c5ba0b0bfe995da40d75e6c52ba9, reproduce the 18 kWh wholesale scheduling scenario and daily maximum-minus-minimum ranges. Pair finite zone-days and compute Pearson correlation.
The output should contain 3,330 pairs and return r = 0.7394366549836897, with no interval reported for this estimand. The current evidence and figure SHA-256 hashes are 1db6f51c7acb612bcb5f0fbdf9b83b7ed8d04545dbcda798f375e2c6c7611cd1 and 767b7c2bc2b425579fd3fec4849d7672322f1b3198de63085046735e1fdedebe.
Disclosure
Analysis and drafting were model-assisted. This public working paper is not peer reviewed. Evidence, assumptions, hashes, code identity, and exact source metadata are disclosed.
It is not trading, investment, tariff, or purchasing advice. Monetary inputs are wholesale scenario values. No external finding was invented.
References
nature-v1g-v2g-2026— Nature Energy. Coordinated planning of European charging infrastructure and energy system for optimal V1G and V2G deployment. Kind: peer-reviewed.applied-energy-smart-charging— Applied Energy. The value of smart charging at home and its impact on EV market shares. Kind: peer-reviewed.acer-retail-2025— ACER and CEER. Rewarding flexibility: How retail contract choice can help unlock consumer flexibility. Kind: official.iea-demand-flexibility— International Energy Agency. Scaling Up Demand Flexibility. Kind: official.ec-sdac-15m— European Commission. EU electricity trading in the day-ahead markets becomes more dynamic. Kind: official.